4 Scenarios for Where the Market's Going Next
March 29, 2024
11%
That’s how much the S&P500 has increased in Q1 2024. 11%.
We’ll use SPY for the S&P 500 above, slightly lower than the index itself, but you get the point. Other notable sectors? MAG 7 (i.e., Meta, Apple, Amazon, Nvidia, Netflix, Microsoft, and Google) and homebuilders as rate cut expectations start to take hold. Energy didn’t do so bad either, nor did some of the other growth areas and industrials.
Overall AI and MAG 7 themes continue to lead the market higher as the weight and influence of those stocks dominate the market landscape. Frankly, why shouldn’t they? It’s a world of have and have nots, an increasingly digitized one where we live, shop, socialize, and congregate on our phones/tablets/computers. Whether your company plays in that space, or doesn’t, greatly influences how the market perceives you and how much you earn. MAG 7 exceptionalism they call it. Just look at the delta in growth rates between MAG 7 vs. everyone else.
Whether it’s pre-COVID or post-COVID, MAG 7 sales are projected to grow nearly 4x more than the rest of 493 companies in the S&P 500. Remember these “other” companies aren’t slouches, but frankly it’s just different businesses. It doesn’t matter if you’re Disney or JP Morgan, Nike or Lululemon. MAG 7 peddles data, and data is free to get, cheap to analyze and repackage, and costless to ship.
So no wonder these 7 stocks keep powering ahead. Now if AI really takes off and is able to take data analytics to new heights (still debatable at this early stage), then that will unlock a whole new level of profitability for these companies. So yes, why these 7 stocks keep powering ahead isn’t a mystery, and in some sense justified. For market watchers though, we are wondering, isn’t it getting expensive? How much is too much of a price to pay for these companies. Moreover, what if the generals (i.e., the MAG 7) lead the market from the front, but the soldiers don’t follow?
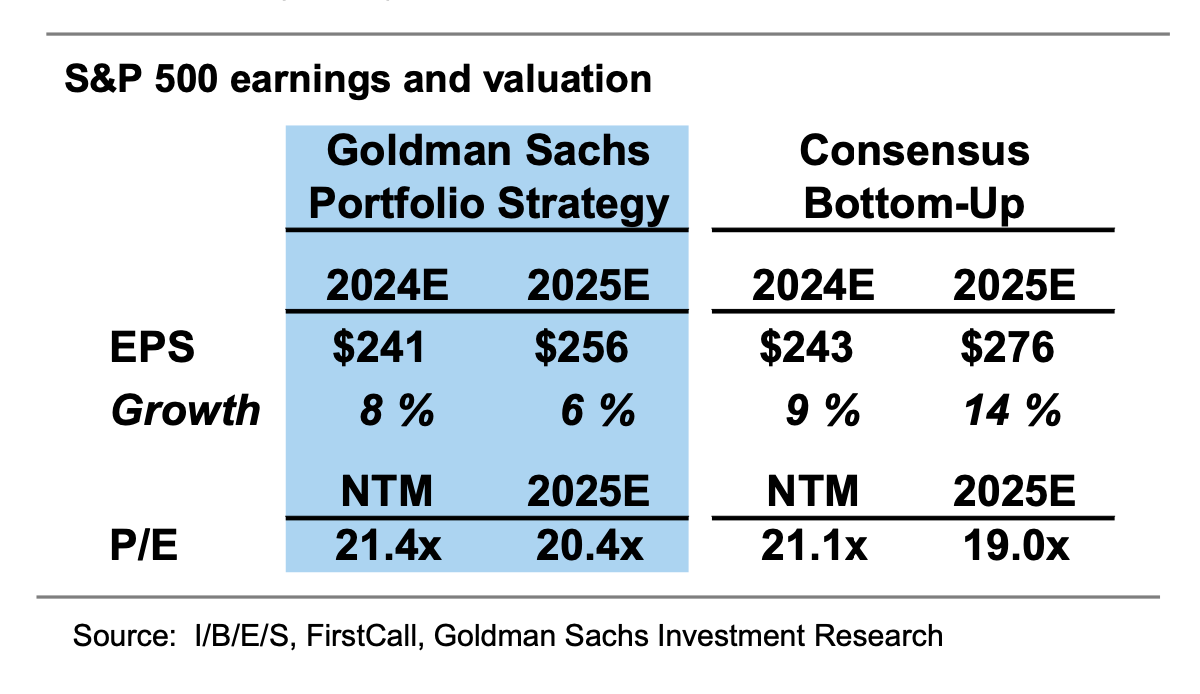
Good questions. Well in totality, the S&P 500 is trading at around 21x the projected earnings of the next twelve month (“NTM”).
Not too devastating, but compared to the equal weight S&P 500 (i.e., RSP, vs. the market cap weighted S&P 500), the S&P 500 is trading at a 25% premium.
Said another way, it’s a top heavy market with the generals leading. Then again, forget looking at revenue growth rates. Look at who’s carrying most of the water as the higher revenue translates to earnings (for which price to earning (“PE”) ratios are based off of) . . .
Dang . . . the E in PE should really be renamed “exciting.” The chart above though really tells you all about the market. Now I know what you’re thinking, what if expectations (whether it’s on the top line (revenue growth) or bottom line (net income) for these guys falter)? Well yeah, if the generals stumble, the S&P 500 will wobble. The more pertinent question though is what happens if the remaining 493 stocks start to perk up as the economy chugs along? What if instead of a drag, the 493 stocks add to the tailwind and play a bit of catch-up? After all, this is consumer sentiment of late . . .
Really though if you game it out, there’s 4 scenarios possible (and anything in between). Goldman summarizes it as two downs and two ups.
The generals (MAG 7) power down as growth expectations start to shrink (i.e., 2021 - 2022). PE falls from 21x today to 17x. A 20% market decline ensues since the generals are so dominant. (DOWN ~20%)
The generals (MAG 7) stabilizes, and the soldiers (S&P 493) catch-up. The soldiers start running, from 17x to 19x. Lifting the entire market by ~10% as the overall market rerates from 21x to 22x. (UP ~10%)
The generals (MAG 7) simply keep dominating, and we really begin to blow a bubble. Call this “Pre-launch Sequence” to the moon scenario. MAG 7 PE expands from 21x to 23x. Market lifts higher by 15%. (UP ~15%)
The generals (MAG 7) stay stead, but the soldiers (S&P 493) get slaughtered. This is the economic risk scenario, where a soft landing seems unlikelier, and things start to get shaky. Multiple falls back to 17x, so 20% downside. (DOWN ~20%)
From our perspective, however, all of these scenarios shouldn’t be weighted equally. For instance, the last scenario means that the Fed will likely step-in and cut rates from the 5.25% we have today. Though they’re again projected to cut rates 3 times in 2024 (by 0.75% in aggregate), there’s still significant room to reduce in more exigent circumstances. So in a #4 blowdown scenario, there’s a backstop.
Moreover, this is the current expected GDP cadence.
Yes, it’s a forecast, but the economy is expected to accelerate here post-Q1, so the economic sentiment isn’t exactly moribund.
Our best guess is #2. The catch-up. If the 493 other companies decide to join the economic party, and management teams begin to surprise on earnings? These guys will really start pushing the market up as the market rally expands.
With rate cuts incoming, and economic sentiment improving as we head to the summer, we should be setting up for a further rally. Despite all the speculative fervor in AI, bitcoin, etc., the euphoria hasn’t exactly seeped into the broader market yet. There’s still a sense that a recession is impending despite the decent/favorable economic data coming out.
We don’t need everyone to clap and cheer, but if they simply stop wringing their hands, then we might make further progress on the upside. If so, the market will lift higher . . . and yes, even for energy investors. Imagine that.
With Q1 in the books . . . we wish you a prosperous Q2.
Please hit the “like” button above if you enjoyed reading the article, thank you.


