
$80 Oil . . . Here We Come
May 28, 2021

Let’s detour briefly from the recent inflation arctic;es and take a quick peek at oil market fundamentals. It’s a theme we’ve been invested in for awhile and despite our purported transition to green energy, net zero emissions and decarbonization, it’s appearing likely that we’re going to need more of the oily stuff for the foreseeable future. Our habit, our addiction, and our need for oil continues, and like addicts we’re already back at the well begging for more.
Before we begin, note that it’s easier to discuss oil products if we classify them into two categories: 1) things that make things (NGPL and propane) and 2) things that move things (gasoline, diesel and jet fuel). Although many analysts begin with crude, we’ll start with products because in the end, it’s the end consumer that matters. If products drain, then refiners will consume more crude to make more products. So we’ll start with the head and the look at the tail.
After a full year of suffering the pandemic’s affects, US crude and product inventories have finally rebalanced, and are beginning to decline further into a deficit. If we take a look at product supplied, which measures products “pulled” from the refineries (and serves as a proxy for demand), we can see that demand is recovering on trend for both categories.
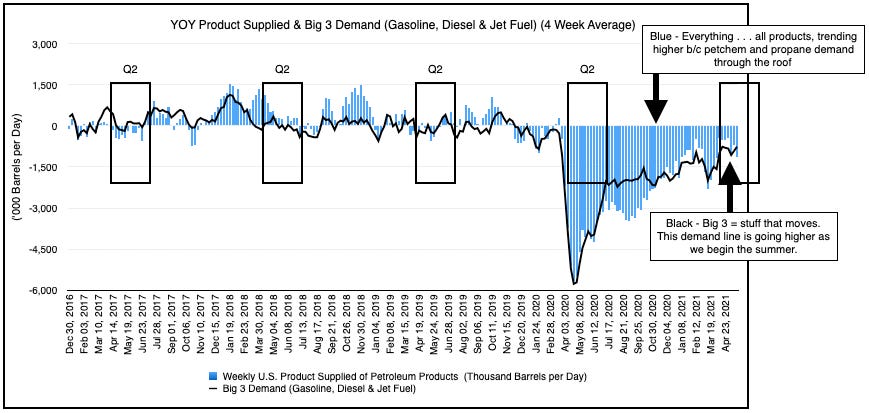
Initially, product supplied for “things that make things” surged as our appetites/wallets expanded for goods during the COVID quarantines. With little to do, we shopped. Consequently, global and domestic consumption of plastics, solvents, and adhesives recovered first. Moving forward, we anticipate inventory restocking will keep the manufacturing sectors busy as retailers depleted inventories to preserve working capital. The requisite restocking will bolster manufacturing, as will the ramp for the coming holiday season. In addition, chip shortages have hampered auto manufacturing, which is a large consumer of such NGLPs, and could provide a further tailwind later as those issues abate.
In contrast, gas/diesel/jet fuel (i.e., things that move things) have recovered much slower, but notice the uptick beginning in March. The timing’s no coincidence. On the back of our successful vaccine rollout, mobility and outdoor activities have begun to recover in the US. Note the word “begun”. We’re near 2019 levels and we haven’t even road-tripped for the summer yet. Accordingly, we can see that for both categories, product supplied are near 2019 levels, and we anticipate product demand for jet/diesel/gasoline (i.e., “things that move things”) will exceed historic levels as the pent-up demand for travel reveals itself.
As for crude, demand for crude depends on demand for the products above. Refinery margins remain elevated, which means refineries are becoming “just in time” producers, waiting for demand to recover before increasing production. Sure enough they’re starting to raise crude runs, but it’s at a steady pace.
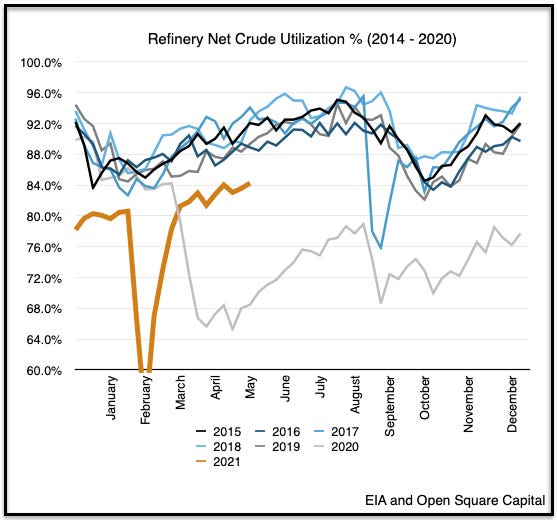
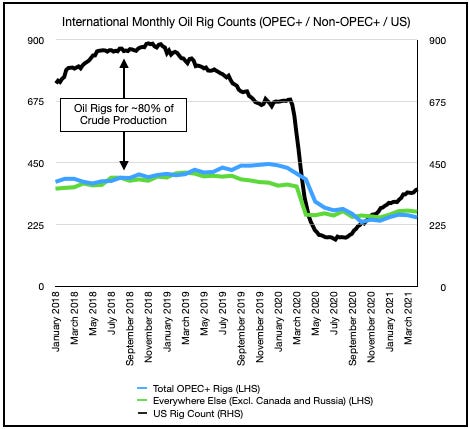
E&P producers further upstream are also staying disciplined so we’re not seeing any material growth in production that’s a concern (actually in the US and outside the US for that matter). Rig counts and frac counts are increasing, but not at the rates they should be if we’re to globally recover our oil appetite by year-end.
Inventories
So let’s take a look at US inventories. As we’re comfortable with demand, how are inventories looking?
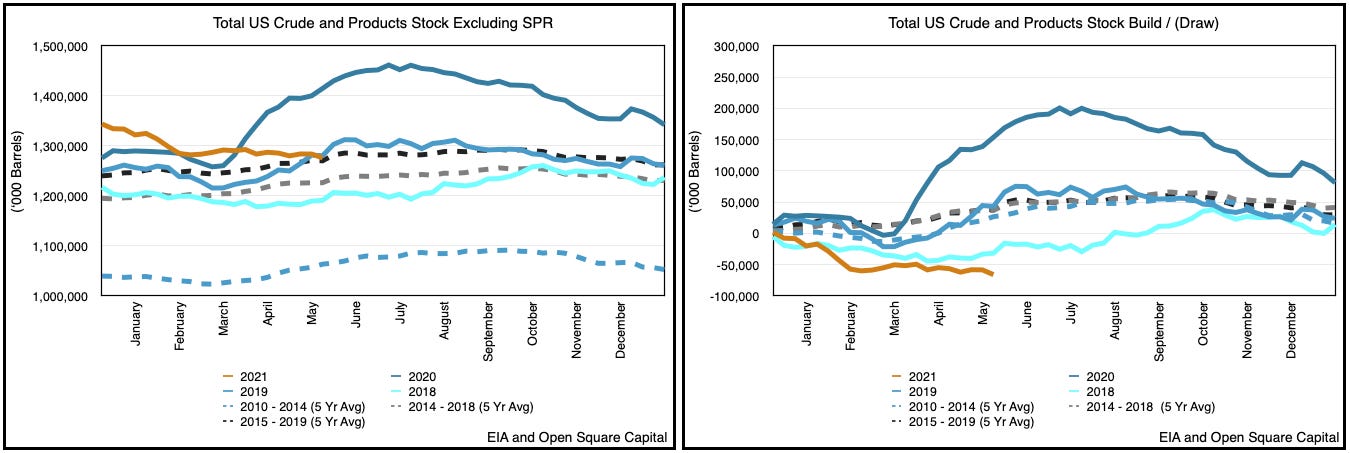
Overall total liquids in the US have touched the 2015-2019 5-year average. We’re using this 5-year snapshot because it excludes the 2020-COVID outlier year that distorts the data. Now total liquids include crude and products, and if we were to bifurcate the two, we can see there’s really not much difference.
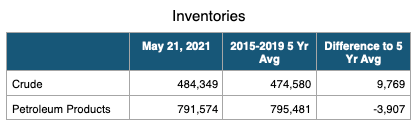
Both are at the 5-year average, which means inventories in the US aren’t completely out of balance. So as we kick-off our summer season with Memorial Day coming up and as WTI printed ~$67/barrel yesterday, our question becomes, will oil reach $70-80/barrel by Q3? Given our rates of draw and the trends, we think it’s likely.
2018
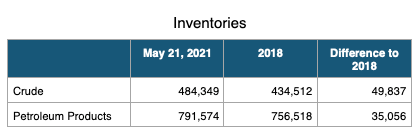
Let’s just take a look at 2018 numbers, when Brent prices exceeded $80 and WTI was close to it.
Although compared to the 5-year average, we’re fairly flat, compared to 2018, we’re about 85M barrels higher, split roughly 50M for crude and 35M for products.
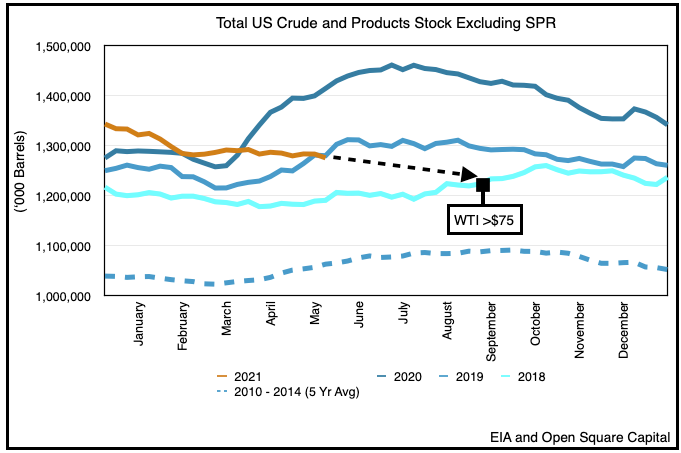
Unlike 2018, however, we’re drawing total liquids today (during a period where we should be building inventories), and we anticipate the draws should continue as demand climbs, but refineries only slowly ramp up.
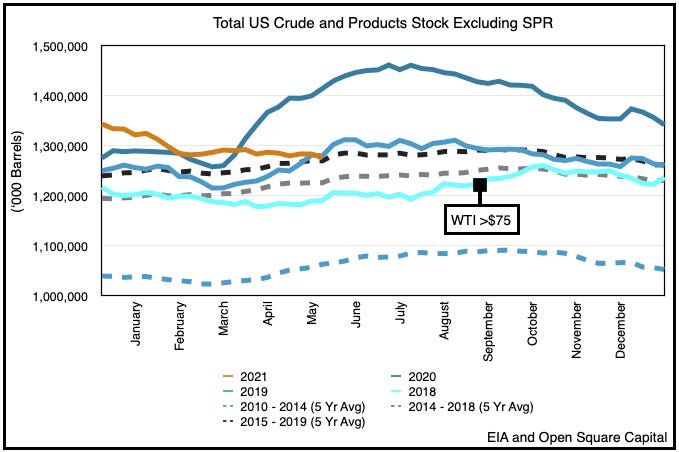
If we revisit this chart, we can see that total liquids typically continues to build into the summer, plateaus around September, and then draws down as we cross into Fall and the Winter. At our current pace, inventory balances will eventually “meet” the “normal” rising trend line of 2018, and when the two crosses, our inventory balances should reflect the same tight conditions in 2018.
Now obviously, oil prices will really look at the future supply/demand balances from that time forward, but we believe unlike 2018 (when the Saudi’s then flooded the market as part of a quid pro quo for US Iranian sanctions), the opposite dynamic exists now (i.e., we see an increasingly constrained market heading into 2022 and OPEC+’s agreement to keep supplies stable (vs. the prior 2018 “flooding”) holding).
Global
Now that’s the US, but what about global balances? Using our proxy/measure for OECD inventories, we again see the same dynamic, whereby we are drawing crude and product inventories at an accelerated pace. Again notice the delta between what we’ve drawn QTD vs. the most recent 3 years.
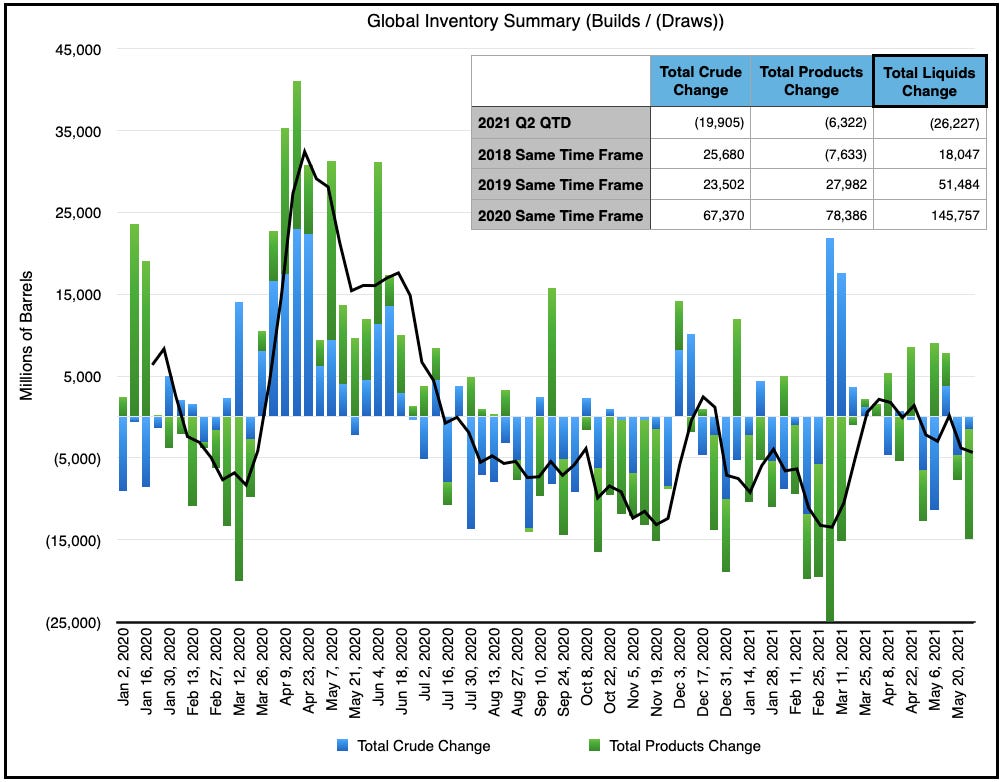
So similar dynamic here. We’re drawing when we should be building, which means we’ll likely see increased draws as summer demand builds and refineries slowly increase production.
On the crude front, OPEC+ has steadily increased production, but all in accordance with their prior agreement. Compliance remains surprisingly high thanks in large part to Saudi Arabia’s determination to bring down global inventories. Recently the market has been worried about the return of Iran, and the potential for that country to add 1-1.5M bpd of crude to the market. In a world where we’re currently consuming ~95M and likely to end the year at ~99-100M bpd, we’re going to need the extra 1M bpd from Iran. Even more noteworthy is that Iran is already exporting more (via smuggling to China via cutouts (Oman/Malaysia, etc.)), so despite what’s being reported, Iranian barrels are already making their way to the market, and yet, oil prices are slowly and steadily rising.
Globally we still have a few hundred million barrels to absorb.
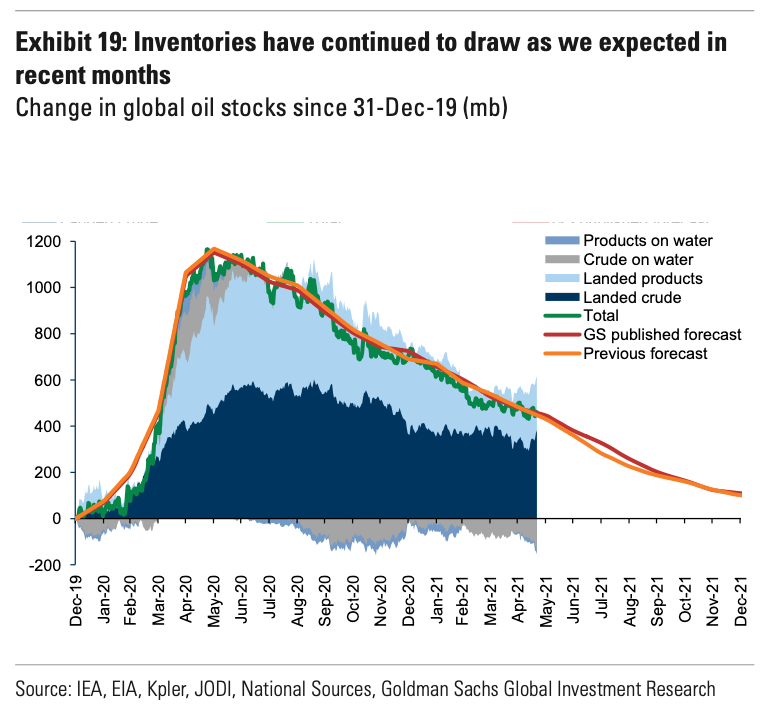
Per Goldman Sachs, that should be done by the year-end (our forecast is slightly faster by a few months, but not materially different). So while certain places (US) have rebalanced first, eventually as COVID recovery accelerates around the world, global stocks will drain.
As we previously forecasted, Europe is well on its way to normalcy, and the snowball of vaccines will turn towards Asia shortly.
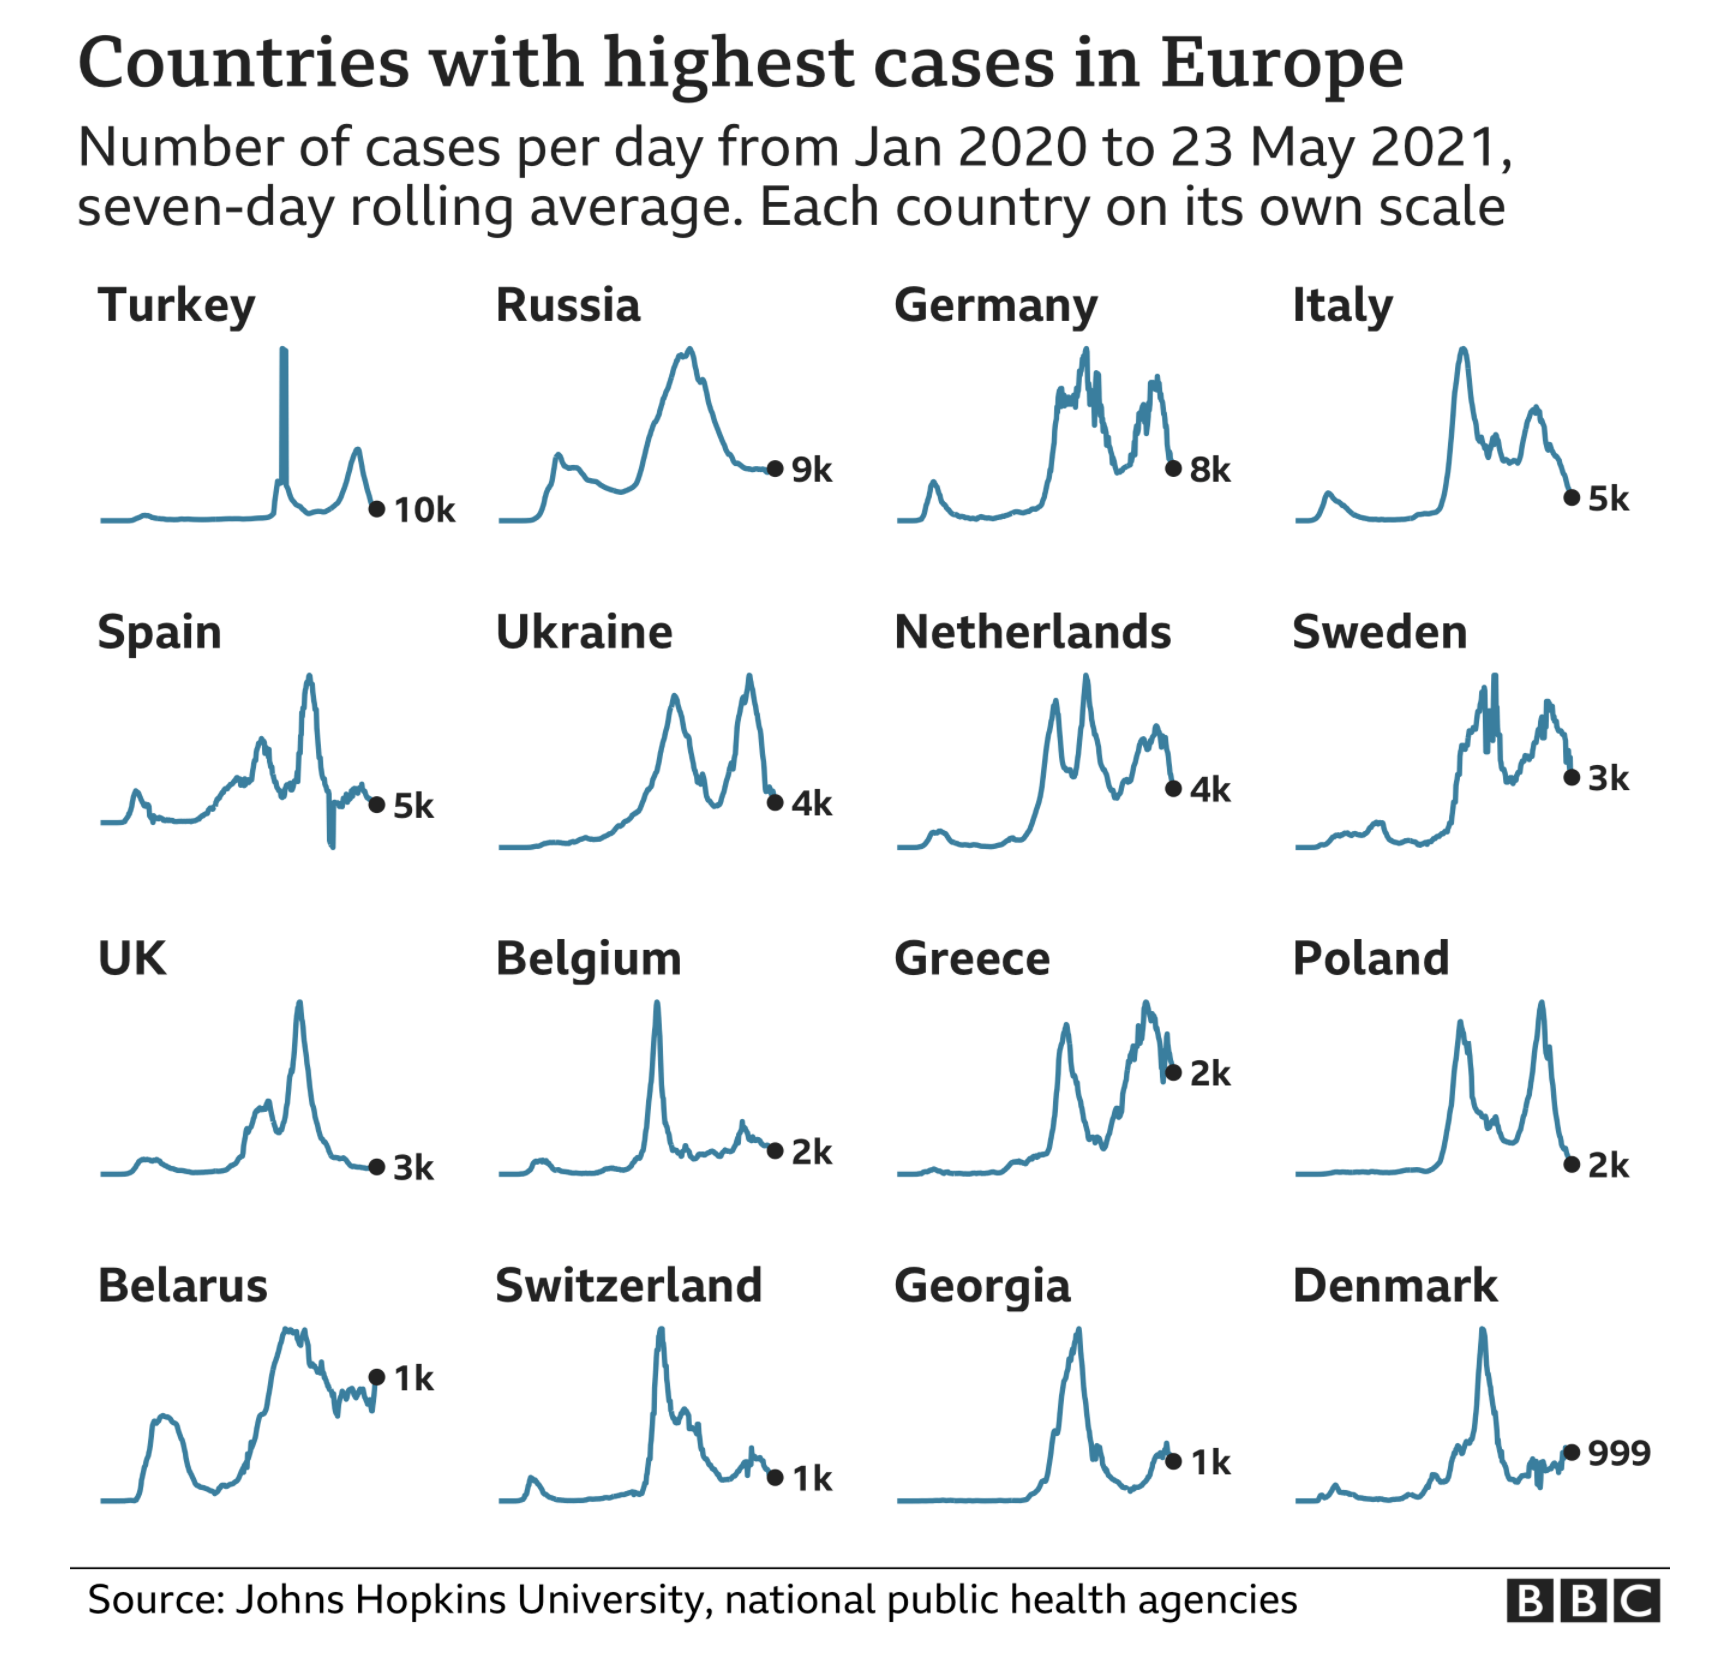
By Q3 Asia should also be largely vaccinated, and then the world heads into the year-end with a voracious appetite to travel, reconnect and live.
Different Commodities, Same Issues
As of today, the path to higher oil prices is largely set for 2021. The question for us is less about whether oil prices will increase, it’s how long they will stay elevated. Traders and oil investors are already peering into 2022, penciling in what supply/demand balances look like, and whether our anticipated climb to $75-80 WTI will be sustainable. We believe so, as the calendar simply marks the passage of time. What’s more important is again this chart.

We’re simply not drilling enough, or anywhere near what we should be once we recover our full 100M bpd addiction. We can’t have rig counts (i.e., the machines and crews drilling for oil) ~30% lower for 80% of the world’s production and not have that impact us shortly, particularly as our appetite for oil returns fully. The supply/demand shortages that we’ve seen in minerals, lumber, agriculture, will now reveal themselves in energy as we recover. We’ve recovered too fast, and equally as pertinent, we’ve invested too little. As we shift from “buying things” to “doing things”, the chronic underinvestment in the energy sector will be exposed. Addicts take note, energy is about to join the commodity party, and our drug of choice is about to get a whole lot more expensive. Party on.