
A Cocaine Bear vs. the Oil Analysts . . . in the Thunderdome
May 20, 2023

Okay fine. I’ll write an article. It’s May, but the California weather’s decidedly June-gloom today. Debt ceiling discussions dominating headlines, and a market selling-off is making me feel a bit glum, chum. Really though, it’s likely the overcast I’m seeing out the window. As a thin-skinned Californian, the lack of sunshine for even the briefest of moments sends me into general malaise, or is it ennui?
Too many SAT words.
Not unlike the energy sector I suppose. General malaise. Wait, those aren’t the right words. General mauling. Yeah that’s it. It’s more apt as the forests are now overrun with bears.

Growling and snarling “I told you sos.” Not surprising I guess. After a bear attack it takes time for them to calm down as the testosterone, cocaine, or whatever fuels a rampaging furry bear-bear lingers in the system. They definitely don’t want what my son wants . . . cuddles.
They scoff at bulls, regaling in the cautionary tale of Dillon Brooks of the Grizzlies, the man who poked bears. Energy bulls they say . . . foolish fools. The bears are dumpster diving now. Tossing out trashcans of facts and figures about energy’s continuing demise. Global GDP slowing, China reopening failing, debt ceiling worries, Iranian barrels destocking, Putin keeps pumping, 3 French hens, 2 turtles doves . . . and a net short in positioning. This state of oil, and we’re in control. So much so that net positioning of non-commercial players (i.e., money managers that trade derivatives) are at their most bearish levels since at least 2011.

Think about that for a second, the investment community is more bearish about energy than during COVID, when the world came to a halt . . . and oil is still at $70/barrel.
Nonetheless, in some sense they’re right. Inventories aren’t anywhere near levels that would garner $100/barrel oil right now.
You want $100/barrel oil? Make another 160M barrels disappear. 160M barrels of crude drained from inventories.
You need to drain 80M barrels from OECD inventories . . .

. . . and another 80M barrels from China (as they’ll likely release 80M from the SPR once oil crosses $90/barrel).

160M barrels in total give or take . . . in 180 days. It’s gloomy May right now.
900K to 1M barrels per day . . . bpd.
Inconceivable? Impossible? . . . or likely?
Kinda depends on who you think wins in the Thunderdome. Cocaine bear, or the analysts. You know, the barrel counters armed with spreadsheets. It’s a battle royale between the two unlikely foes, and it’ll be interesting.
Here’s a snapshot of 7 analysts. (FYI - we track almost every analyst in this field. If you’ve been in the energy trade long enough, you see it all.) Big banks, government agencies, quasi-government agencies, and third-party analyst/research firms. We assure you, all of them are well known, or at least in the space.

In almost every forecast, demand is about to jump here. Dig deeper on the reasoning though and it’s apparent. It’s not just blind growth, or pure conjecture, it’s seasonality. On average, global oil demand increases by 1.7M bpd from the seasonally slower H1 to the heavier travel seasons of H2 (summer/holidays).

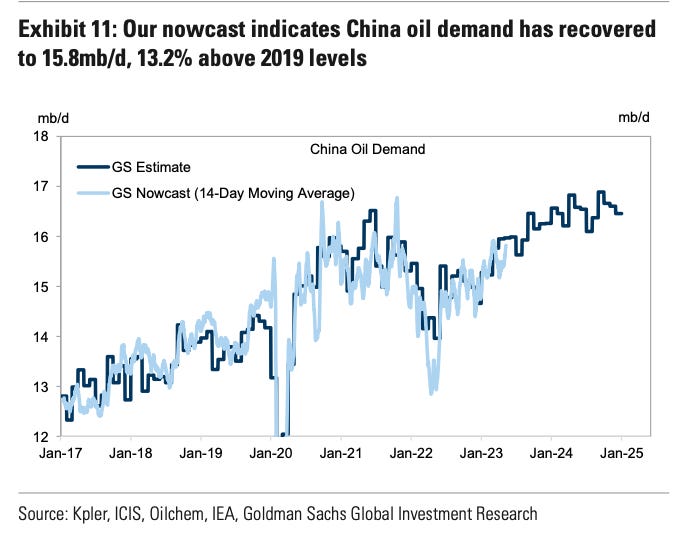
Analysts anticipate the same this year, but with a slight twist. China’s recovery will/should continue. No one believes that though because we’re about to have the most anticipated global recession ever. Moreover, China’s demand has disappointed. Has it? Because that light blue line thingy sure looks close to that dark blue line thingy.
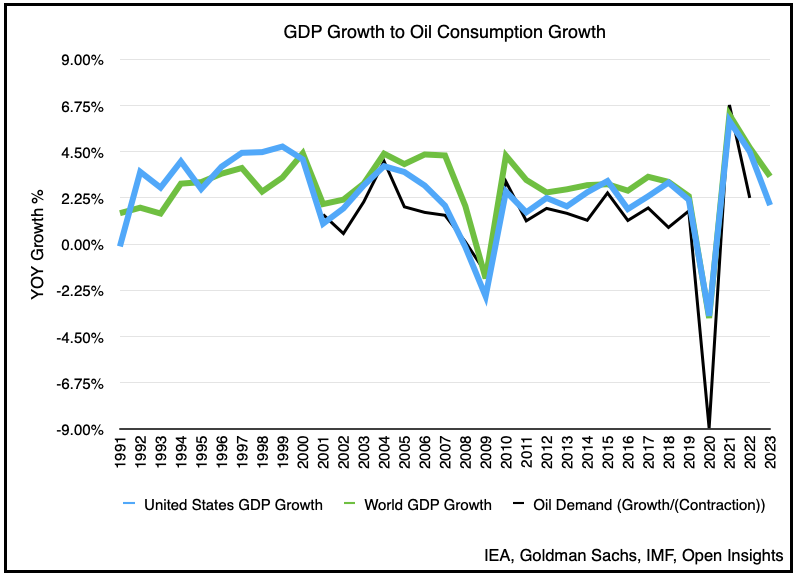
What’s interesting is that many of the analysts above have also baked in a mild recession in the OECD (300-600K bpd of OECD demand hit), and consumption is still growing in H2. Again that’s seasonality. More accurately, this year it’s seasonality coupled with an OECD recession offset by China’s recovery. Even against the recessionary headwinds, analysts anticipate a global draw between 700K to 2M bpd.
Again . . . we need 900K bpd.
900K bpd.
What if we’re wrong though? What if the recession is the Great Financial Crisis 2.0? It blows out the mild-recession assumption, and leads to the same 1.4M bpd demand haircut. Then the question morphs into . . . how long? How long does the recession or GFC 2.0 last? Six months, a year? How much will a GFC demand hit delay the recovery impact. Let’s assume OPEC+ doesn’t respond, let’s assume supplies don’t collapse in the face of depressed pricing. A year? Is 2023 a wash, and now we’re into H2 2024? Maybe . . . but the key thing is . . . it recovers, and relatively quickly.

It not only recovers, but whatever demand hit occurs, it should rebound faster this time because again China is still recovering from a zero-COVID policy (“ZCP”). Although the recovery hasn’t been as robust as we anticipated (we were even more bullish than Goldman on that), it is still recovering. A GFC 2.0 would certainly set that back, however, that recovery process should be aided once again by China’s reemergence from ZCP.
Still, a GFC 2.0 is still indeterminate. From all the negativity out there, it almost sounds like a certainty. The forecasts are what they are, and a mild recession for most analysts has already been baked in. Anything more would delay, but not eliminate, the structural shortage we’re seeing. Like a charging bear, oil demand is . . . relentless.
We believe that a really warm winter, a seasonal lull, collapsing banks, and macro-uncertainty have invigorated the bears. Rightly or wrongly, it matters not because the final arbiter is the price. We’re just looking down the road, however, and asking what’s next? We’re not sure, and there’s never any certainty in the energy markets, or the market at large, but it’s helpful to assess where things stand and the various assumptions/arguments advanced by the participants.
So as everyone stares at one another in the Thunderdome, be it human or beast, place your bets (or not) because inevitably two things enter and one thing leaves.
The season’s about to change . . . and it’s . . . cuddle time.
Please hit the “like” button and subscribe below if you enjoyed reading the article, thank you.
Bears can be warm and fuzzy. Their parents hated them so we must be patient 😉
Excellent article but you, like everyone else, commit a serious chart crime by not adjusting the oil price for inflation. You show data going all the way back to 2006. Inflation is 50% since that time. https://www.usinflationcalculator.com/ In other words, oil at $72 is the equivalent of $48 in 2006--extremely cheap relative to most of the last $50 years. Ultimately, supply and demand dictate price, but the notion that the nominal price should be at a certain level because prices were at that same nominal level years ago when inventory levels were comparable strikes me as odd.