
Our Economic Animal Spirit? A Chipmunk . . .
September 15, 2023

Okay where are we?
It’s something I like to ask once in awhile to get my bearings. We’re so deep into investment research/micro-research that we sometimes forget to look up; so focused on the rubber duckies in the bathtub that we forget to check the water.
So what’s it look like? Where are we?
Well . . . sentiment seems to have bottomed and is picking up. For businesses (both manufacturing and services) . . .
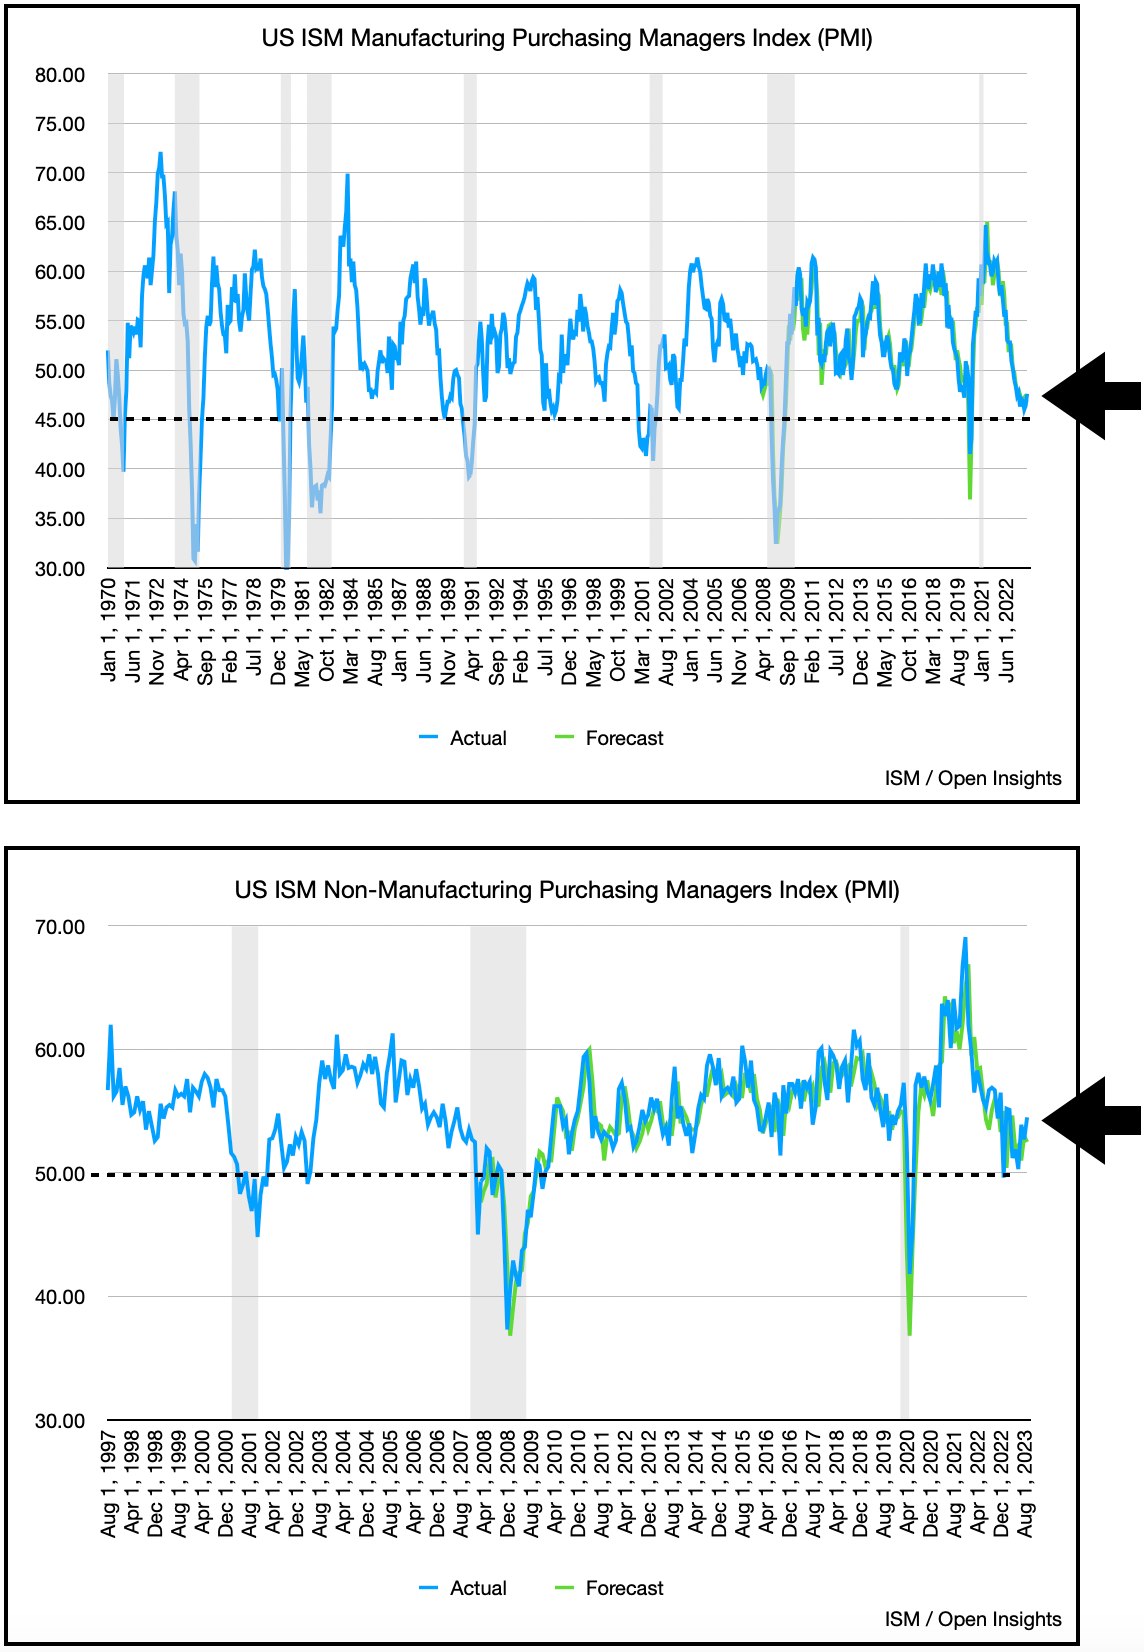
and for consumers . . .

Retail sales have also stayed steady, with no material drop-off . . .

Largely because employment has stayed tight. Despite open positions beginning to normalize, there are still almost 2.5x more job openings than unemployed.

Higher wages are certainly incentivizing more people in the prime age (25-54) demographic to return to the labor force . . .

but those older (age 65+) have not, and likely will not, return.

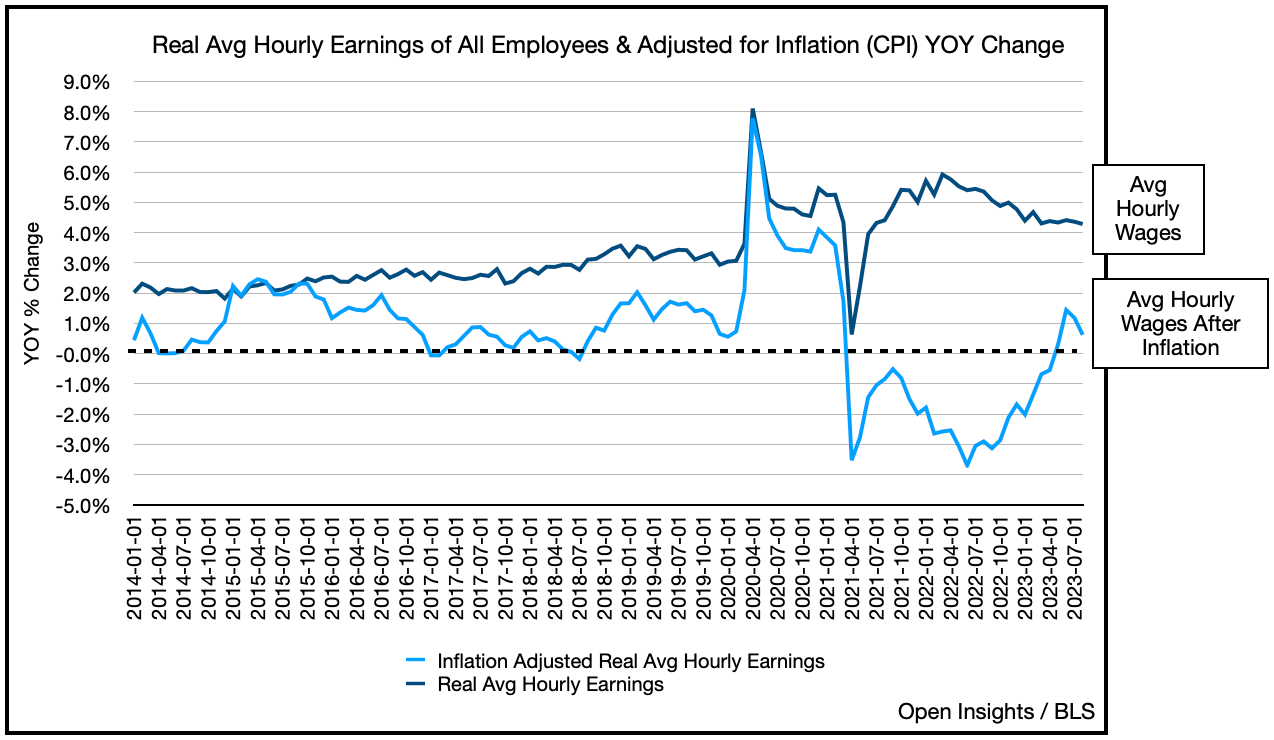
This still explains wage inflation, which is staying above inflation . . .
As a headwind, however, inflation is beginning to rebound as the rise in energy (i.e., oil prices) start to impact the CPI and PPI . . .

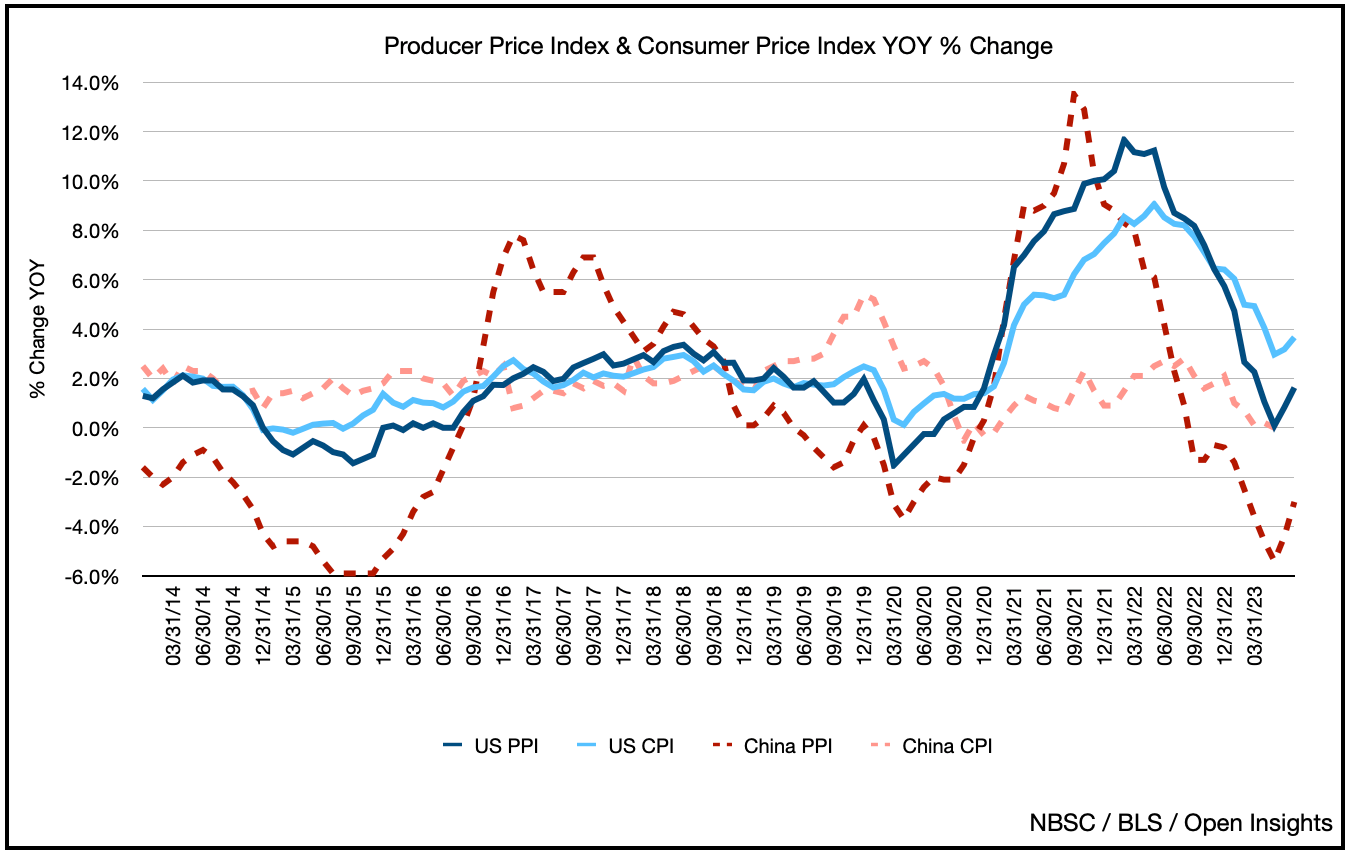
Much of the inflation after-shock, if we can call it that, will continue as oil prices rise. If we’re correct and the Saudis continue to tighten the oil market, we’ll likely see $100/barrel before too long. Good for another 0.3-0.5% jump in the CPI.
Again, inflation staying higher for longer will impact rates, and we’ve already begun seeing that play out as the longer-end of the curve (+1 year and forward) have started creeping higher in the past few weeks.

Still despite all that, go back to this chart. There’s a discrepancy between sentiment and employment, something that’s historically tied together.
The delta post-pandemic has been extraordinary. Could sentiment be a leading indicator? Possibly, it’s typically dipped before unemployment rate starts to skyrocket (unemployment rate has been inverted in the chart above), and that’s been a precursor for recessions. Hang on though, because it is different this time (yes, we know that’s a highly loaded phrase). We again go back to the job openings vs. unemployed chart. It’s a tight labor market and jobs are still plentiful. Throw in the fact that consumer debt vs. income is still relatively stable (i.e., not blowing out) . . .

. . . and what we’re really seeing overall is a sentiment issue. Things “feel” more “meh” than they really are. Things seem to be expensive, and things seem to be getting more expensive . . . and they are, but there’s a bit of an anchoring-bias we’re also seeing. An anchoring-bias to pre-pandemic prices. Anecdotally, I for one remember wistfully the days when a weekday lunch costed less than $10, and that was only 3 years ago.
Even though our pay/income is keeping pace, even though we have jobs and our debt levels are “okay,” or at least not higher than pre-pandemic levels, we appear to be running in place.
Remember consumer spend drives this economy, and what we’re saying is that the consumer appears to be financially fine. As good as before? Maybe not as things have fallen off slightly, though not materially. Are they in dire straits? Certainly not, which is why you likely still see people out and about. Sentiment should be higher here, but it appears that the animal spirits have left us a bit. At the very least, the animal’s shrunk.
It’s more chipmunk than robust strong brown bear, when it maybe should be somewhere in between.
So overall . . . where are we?
Kind of running in place, not too high, but not too low . . . all the while carrying around this little fella.

In short, it’s a chipmunk type of economy.
Please hit the “like” button above if you enjoyed reading the article, thank you.