
Two Chart to Contemplate on MLK Weekend
January 17, 2026

Happy New Year, or happy new weeks we should say.
A few odds and ends that we’re looking at this week as we wrap up our quarterly letter in the coming days, which we’ll publish once we send it out.
First payroll figures. Well really withholding taxes on employment income. It’s been an interesting tracker that we’ve used to see what the momentum of the economy is like. Here’s the latest update of the chart.
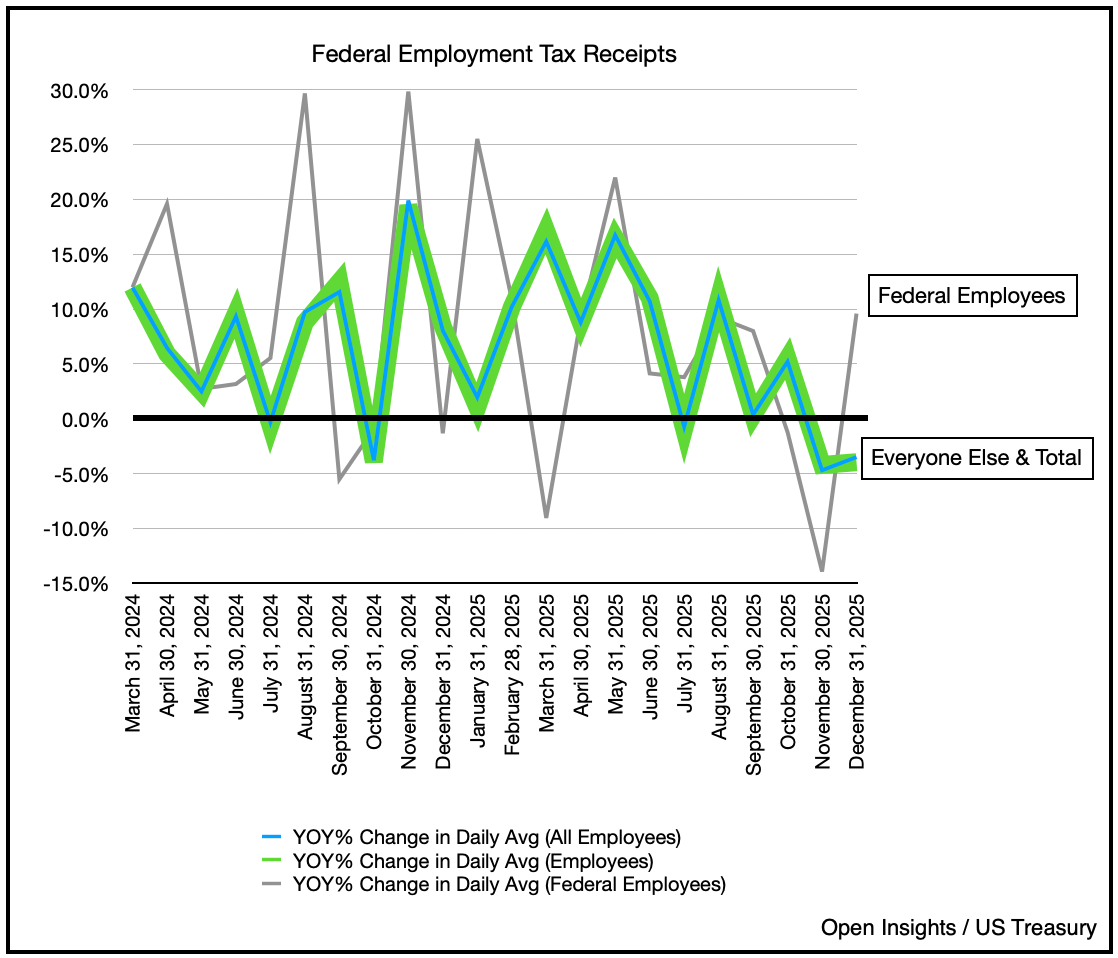
The logic on this one is fairly simple. Withholding taxes on employment income = employment. Sure there’s some flux b/c of pay raises, etc., and seasonality, but for the most part, it makes sense. If you have employees, employers have to withhold, and if you’ve fired your employees, then well, daily withholding should decline.
What we’re seeing is that employment appears to be weakening. These are year-over-year comparisons, so it can get choppy, but the trend seems to be clear. Certainly the government shut-down in Q4 had a large impact on private wages. The layoffs rippled from federal employees to contractors as well, so there could be some lingering effect. Government withholding is about 4-5% of the total pie, so it’s a blip in the grand scheme of things. Perhaps the ripple effects is 2-3x that in the non-federal employment sector, which could explain the recent dip.
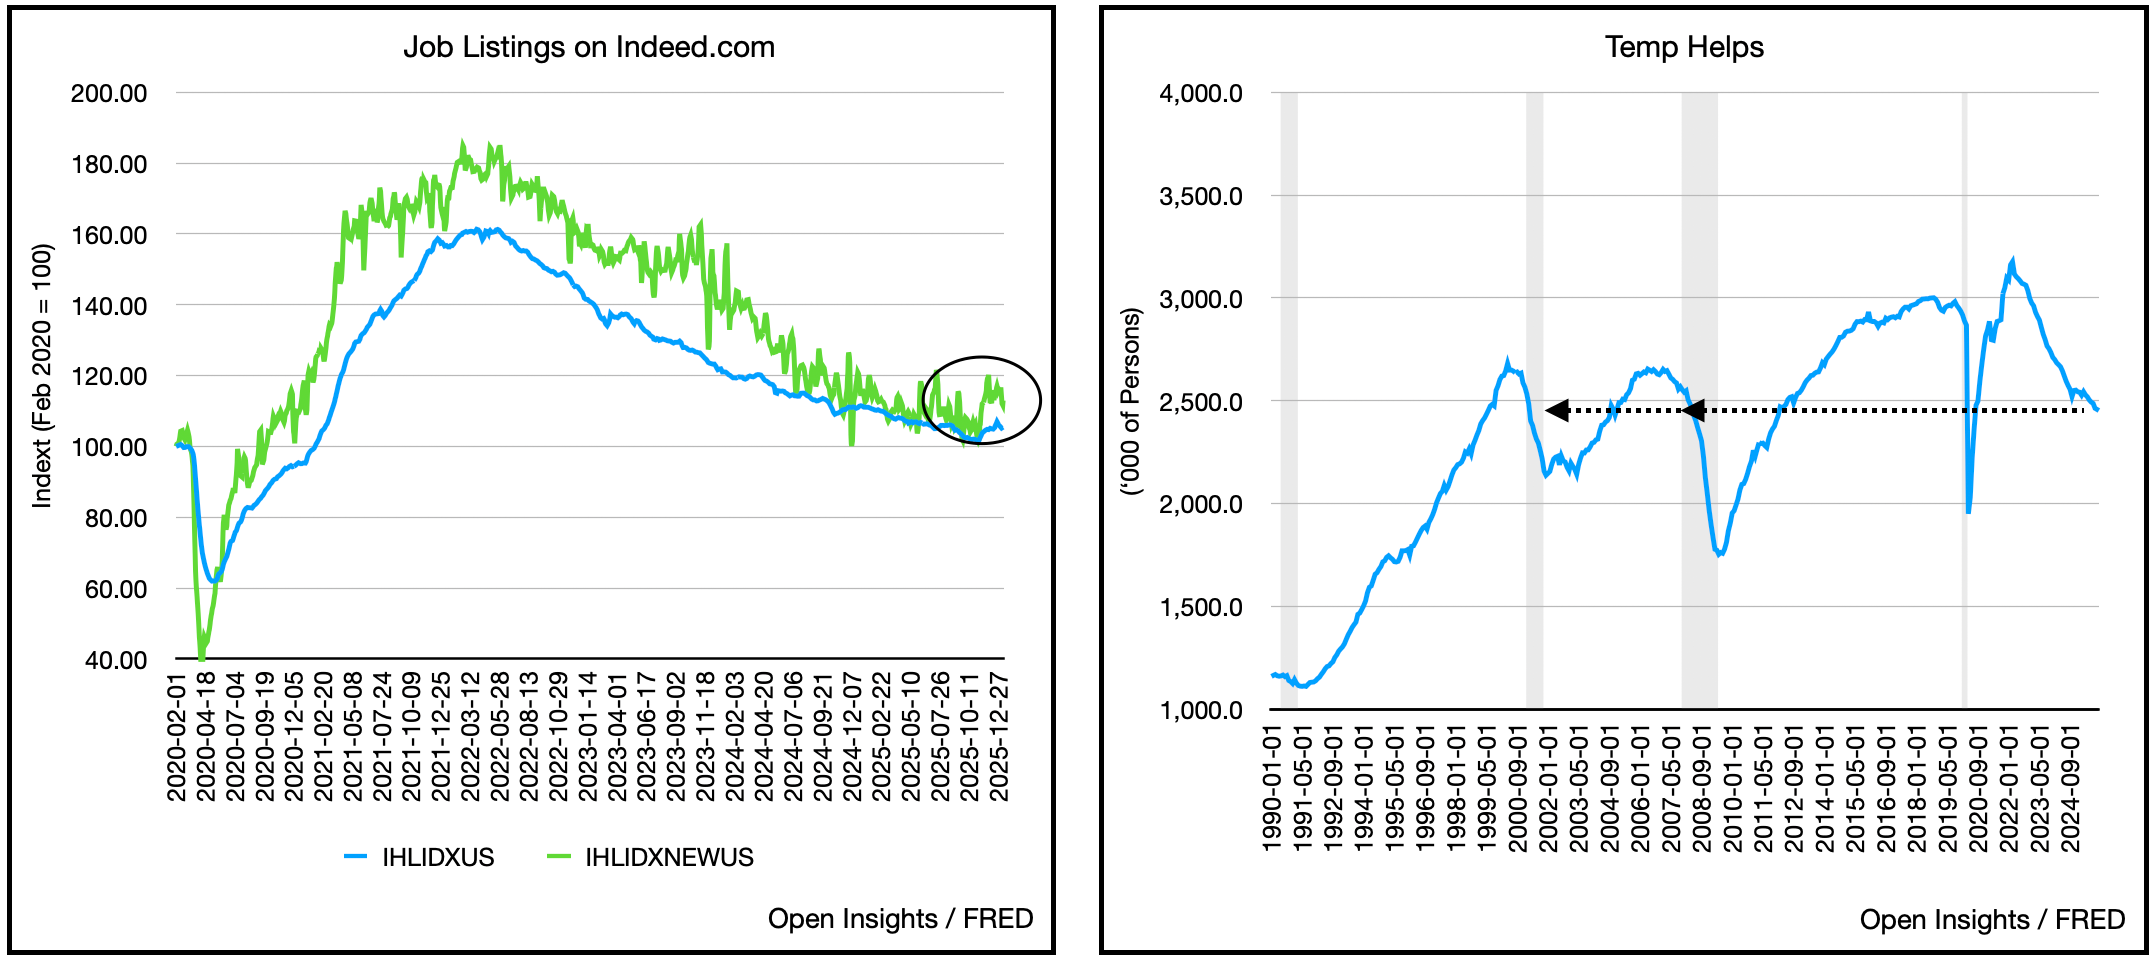
As a corollary, job postings on Indeed.com have increased slightly, but that’s likely seasonal. Temporary labor hirings also appears to be falling, which isn’t a great sign. In total, we’ll have to see how the January and February data comes out, but as we enter the new year, employment does hint at some weakness.
To combat the economic malaise, the Trump administration will attempt to juice the economy ahead of crucial midterm elections, so that may offset. As the forces push and pull though, this second chart has us handwringing a bit.
The market? It’s expensive . . . and historically so.
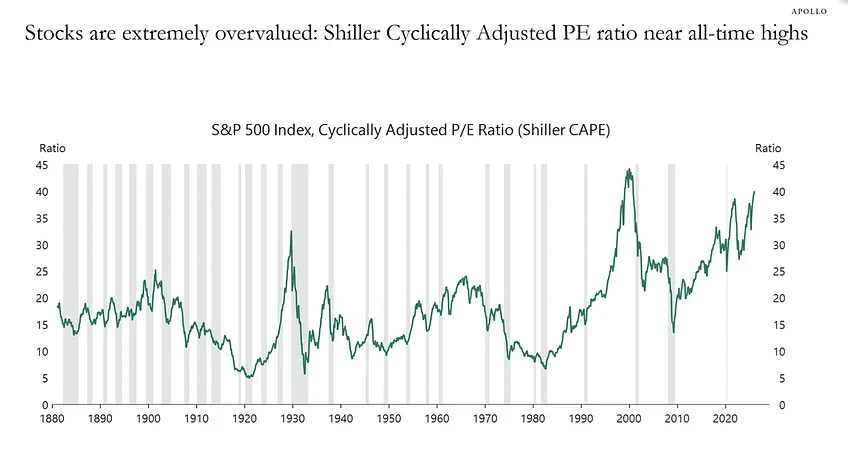
Now we know, there are various reasons why the CAPE Shiller Index isn’t the be-all-end-all for indicating when a market is overvalued, but Apollo isn’t necessarily wrong here. The index supposedly doesn’t capture the value shift of stodgy old companies to the new fangled tech, and tech (e.g., MAG 7 like Apple, Amazon, etc.) should arguably garner a higher multiple given the sustainability and profitability of their businesses. Since tech dominates the indices these days, naturally the CAPE Shiller Index should be higher. Fair enough, but at 40, it can still easily fall (and has before back below 30, and even that haircut of 25% would be exceedingly painful (think 2022).
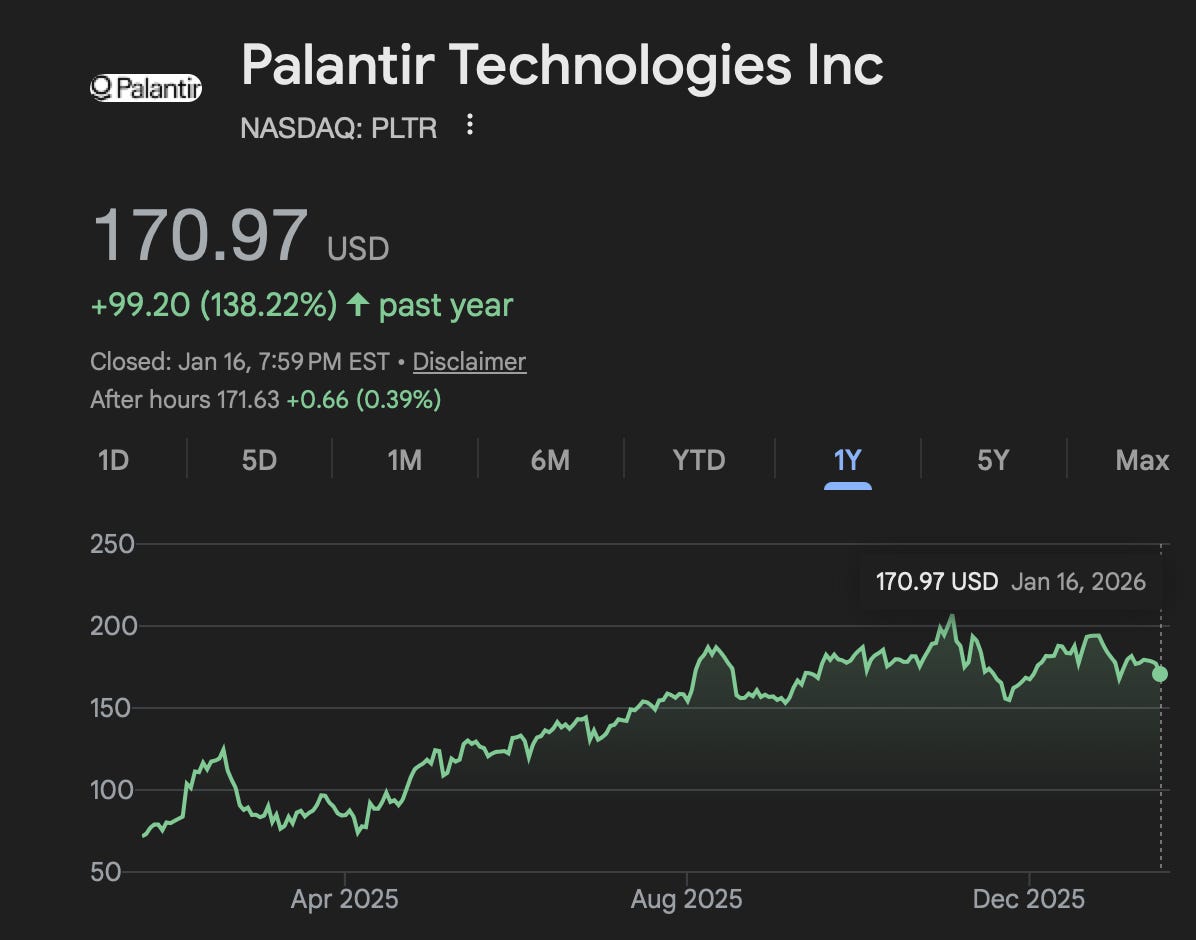
As we look at some high fliers, after crossing into the new year, we begin to think . . . what propels something that has already mooned further past the moon? When we’re already valuing companies on multiples of REVENUE, how high, and more importantly, who could, power this market higher? We don’t know, but on balance, doesn’t these things look to be at best flattening?
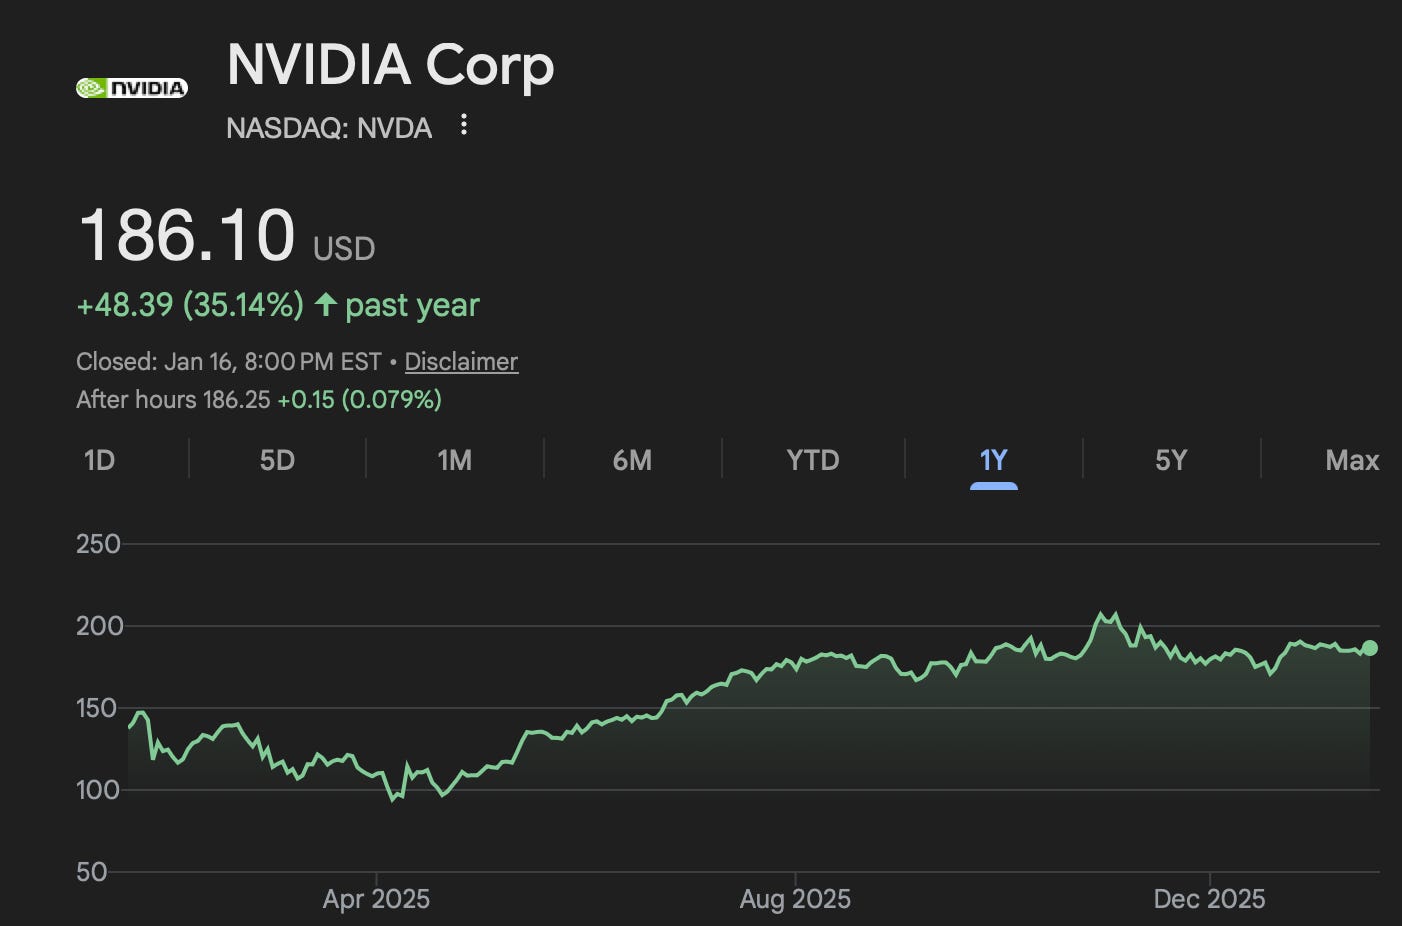
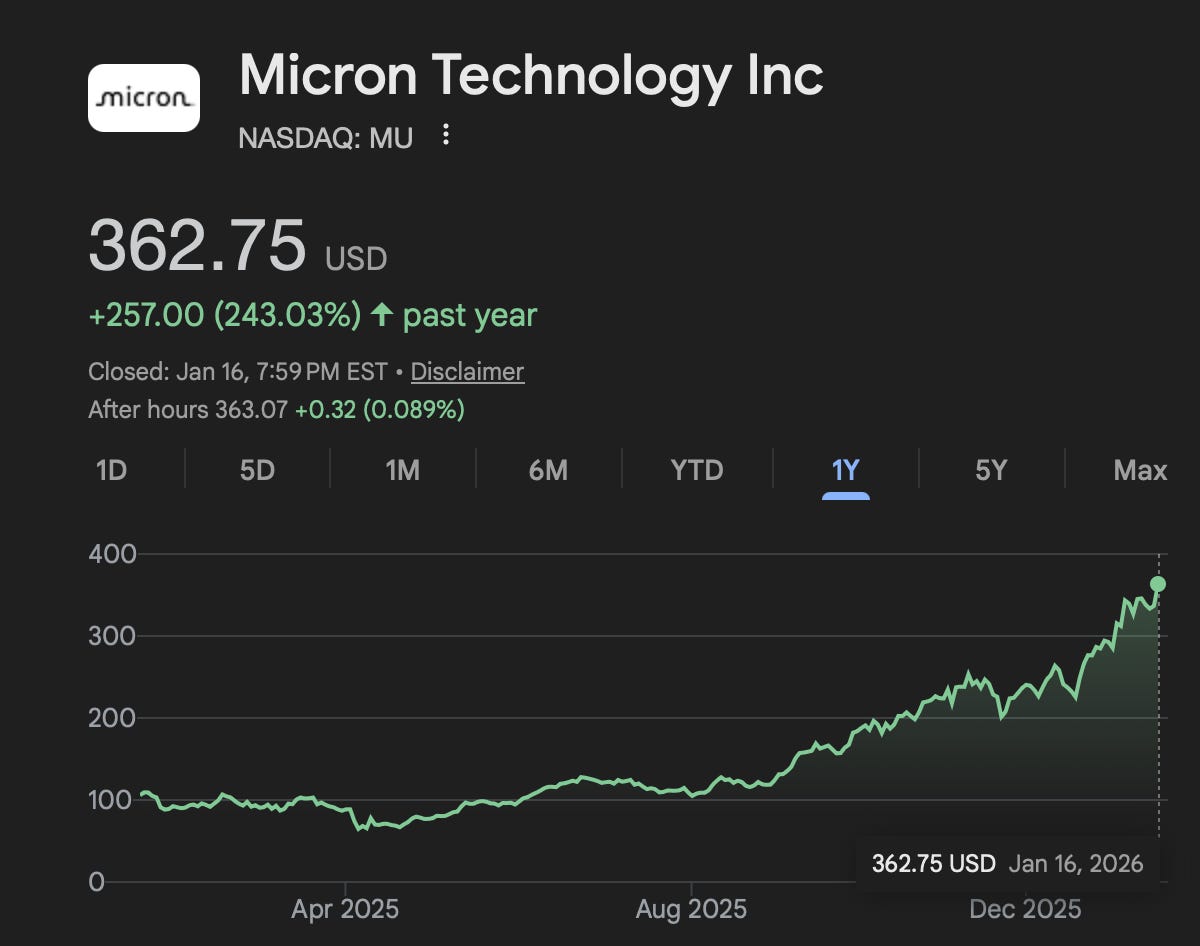
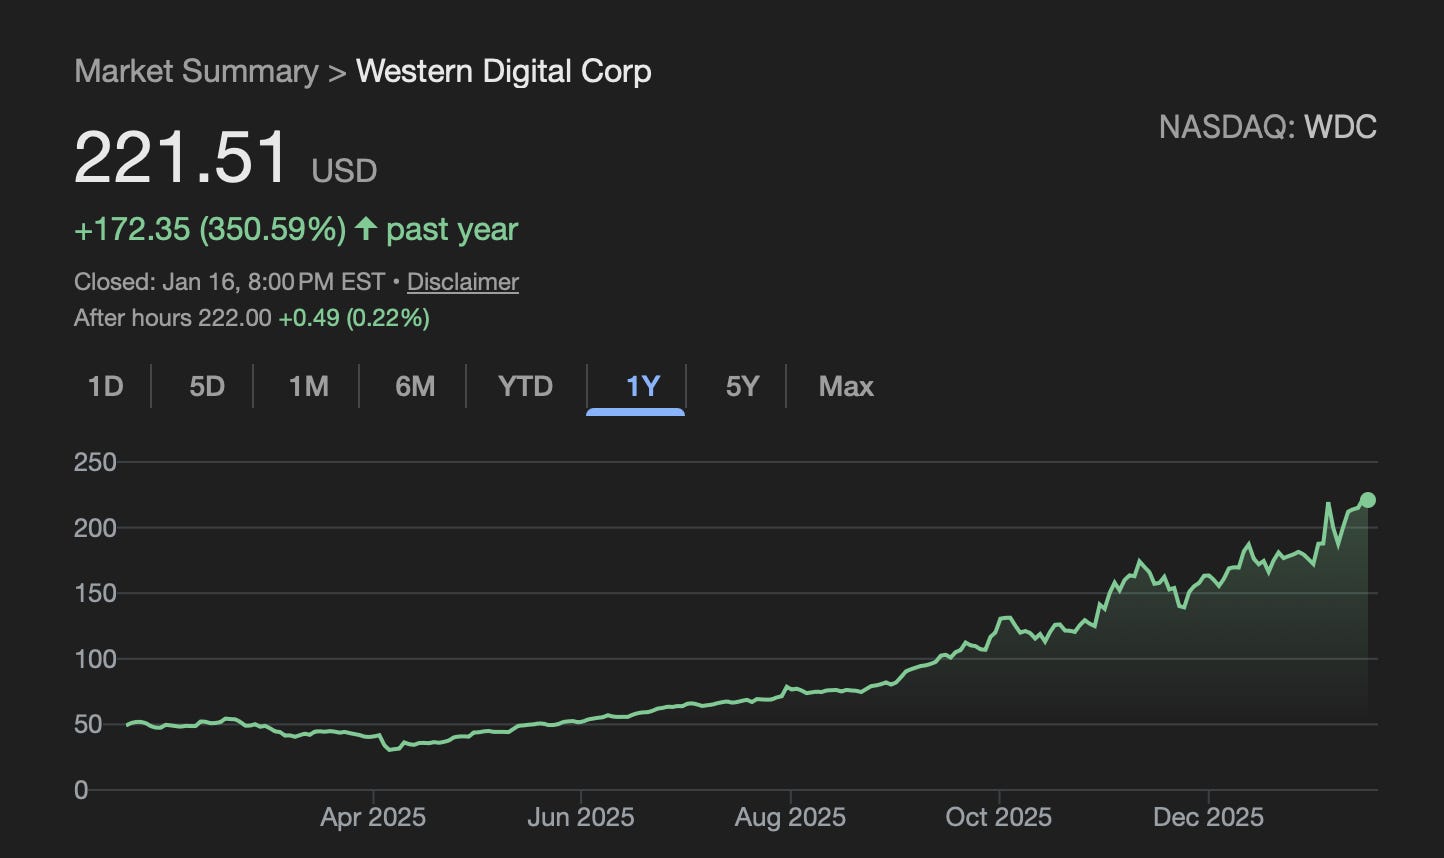
Perhaps the liquidity is just finding new places as memory and storage chip makers get their turn at the punchbowl.
How outlandish is this really? Let’s zoom out.
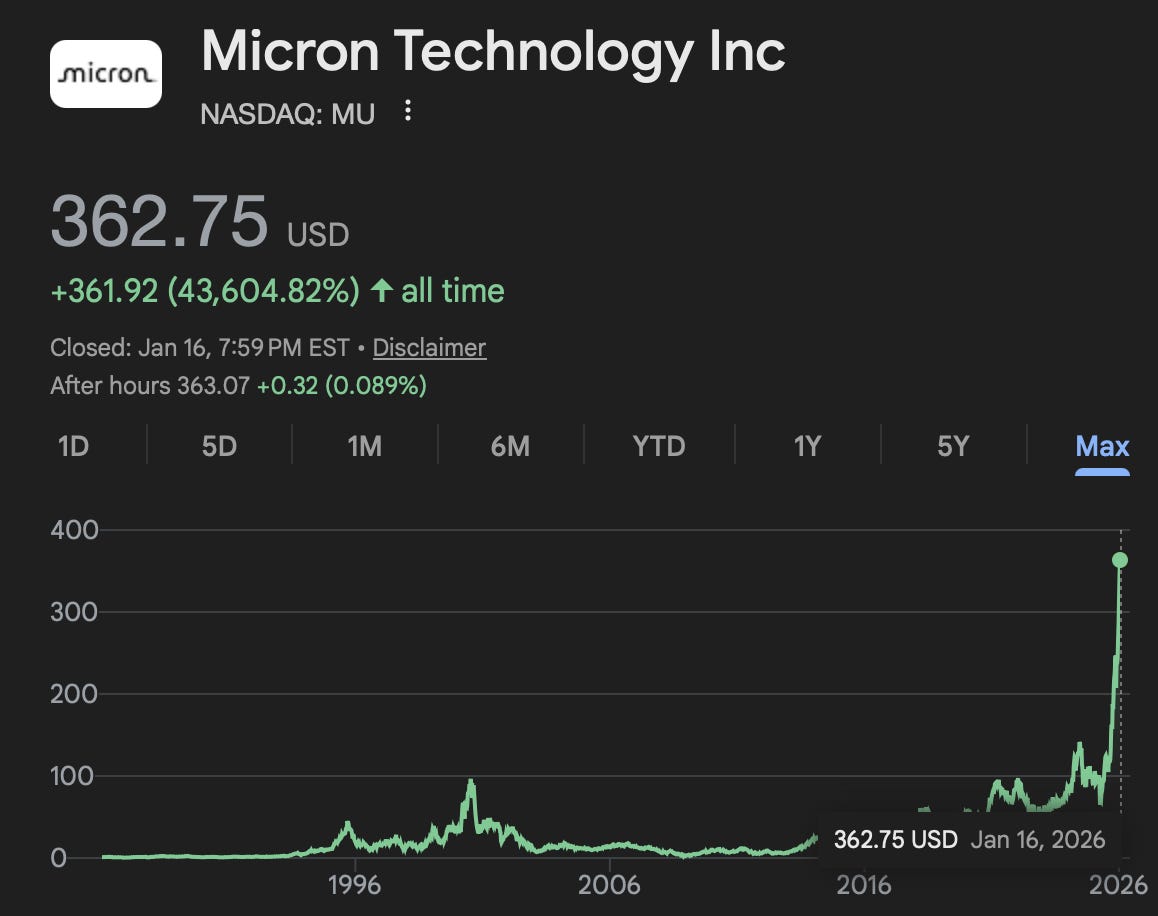
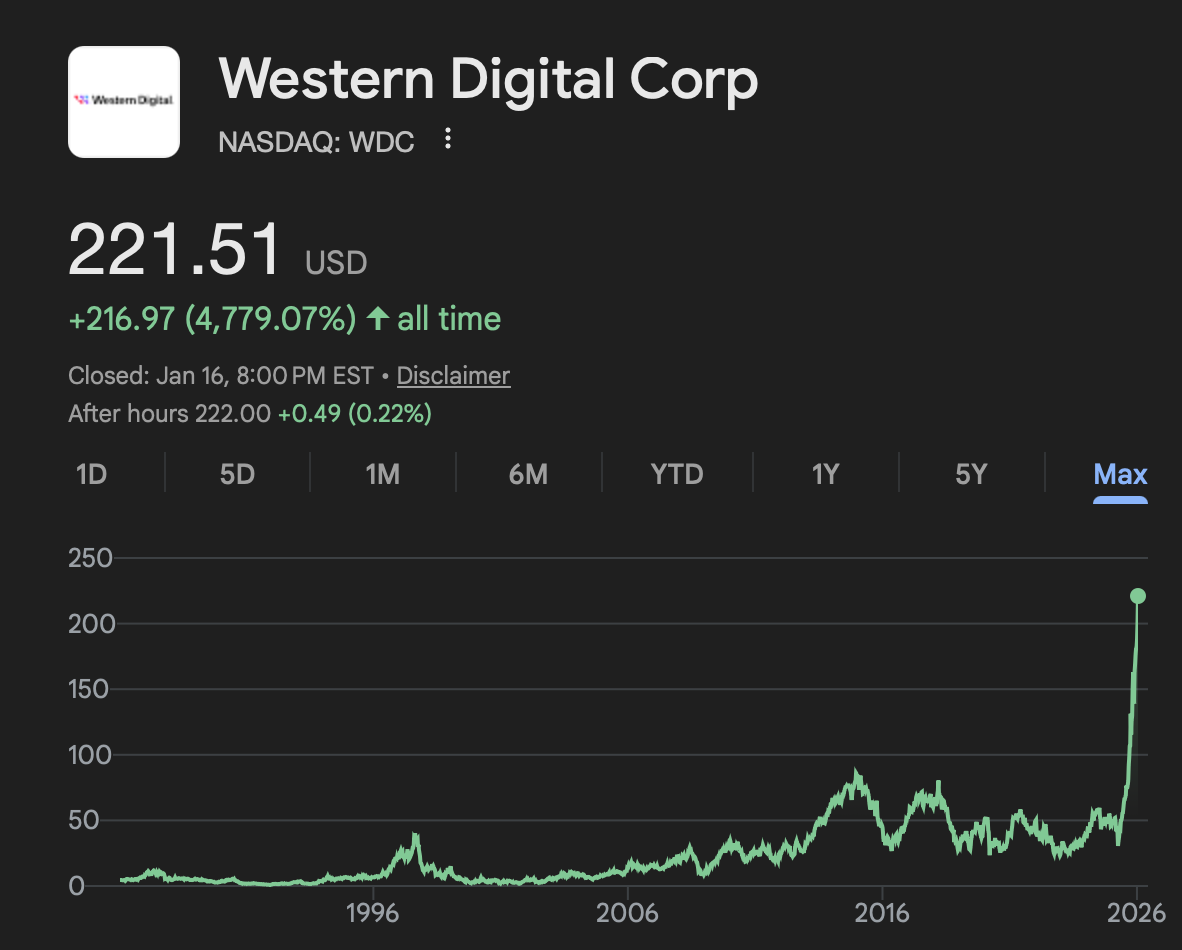
Yeah . . . insane.
If we’re mooning the stocks of companies in the very definition of heavy capex and commoditized industries, we are certainly in the very late innings of market mayhem.
Again, it’s important to remember that the stock market is not the economy, but it sure will impact the economy if: 1) we’re in a “K” shaped one where the rich are powering the economy while the less affluent are getting hammered by inflation. Guess who’ll feel the “negative wealth effect” if the market dislocates, and 2) what will happen if we hit a funding crisis if the public market gets hit? The exorbitant AI capex spend that’s currently powering the economy will slam into reverse if funding dries up in the public markets, venture capital sector, and private equity. Public markets have a significant impact in the private ones. Heck, the market has run so far ahead that it doesn’t even need to dry up, if funding simply doesn’t grow as fast, then watch out, this thing can tip over.
So two charts and a few more to mull over on this long weekend. We’re feeling cautious here as we start the year. Happy New Year, and Happy MLK Day to you all.
Please hit the “like” button and subscribe below if you enjoyed reading the article, thank you.
Interesting to see how you pair the withholding-tax trend with the CAPE chart. And the question that if employment is softening at the margin and valuations are sitting around 40 on Shiller, who exactly is left to keep pushing things higher, on a potential new leg from here? I learned something new regarding the Indeed postings, some nuance, indeed. See what I did there?