Waning Fiscal Impulse on Oil Demand and a Stealth Stimulus? Ponderings for the Week.
August 27, 2021
So we said this in our last note last week . . .
“Global growth is slowing”
. . . and we wanted to elaborate on that a bit this week. Let’s just get the numbers out of the way. On a high level, when we say “global growth is slowing” we really mean that global growth is falling from 6% in 2021 to 4% in 2022.
Mind you global growth is still GROWING at 4%, and that 4% growth is roughly a third higher than our global average for the past decade (and that’s excluding the 2020 pandemic year of negative growth). Said another way, that 4% growth penciled for 2022 (i.e., less than 5 months away)? Yeah that’s hyper-juiced growth.
So let’s take a moment to gather ourselves before hyperventilating that the sky and global growth is falling. It isn’t . . . it’s still growing and at a really high rate.
When many fret about the slowing pace of global growth, what they’re pointing to is a slowing of fiscal impulse. That’s the “juice.” It’s the nitroglycerin shots of government stimulus we’ve been dosing with since COVID began, and it’s overtaken monetary stimulus to be the main tool to reflate the global economy.
We’ve discussed the reasons why fiscal spending has overtaken monetary stimulus for our recovery, as we wrote:
“Eager to avoid the criticisms of the GFC and replace income lost due to the draconian public health measures, the federal government rained down money in the form of stimulus payments, PPP, unemployment benefits, grants and forgivable loans, which effectively bypassed commercial banks. Our current COVID response effectively subserviates the central bank. Engaging in massive fiscal deficit spending means co-opting the Fed to print and fund whatever Congress and the White House decides.”
So the CARE’s Act, December 2020 extension, and the American Rescue Plan (2021) were all part of the recovery process. Arguably necessary to bridge us to a day where vaccines were readily and freely available. Such a day has fortunately arrived.
Although our federal government is now on the precipice of approving a $1T infrastructure bill (i.e., $550B if we’re only counting the “incremental amount of new spend”) and $3.5T of additional stimulus (i.e., for human infrastructure spend), the spend will be spread over 10 years and offset with new taxes totaling $1.5T. So the next phase of federal stimulus will be sprinkled over a longer period of time, and unlike the broad brush (or rush) of earlier programs, more narrowly tailored to certain aspects of our social safety net/economy.
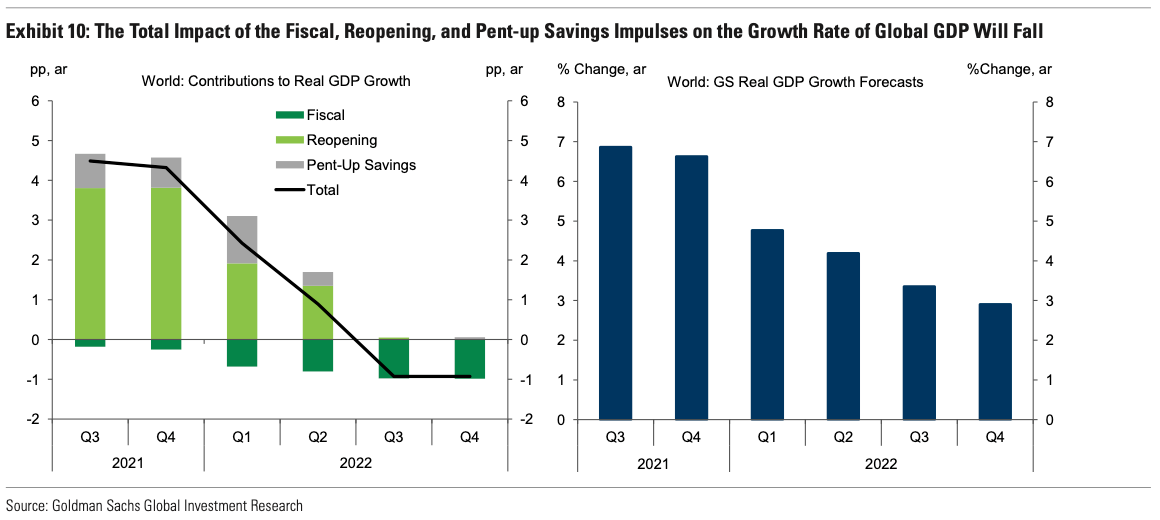
As we recover from the pandemic, governments worldwide are beginning to dial-back the debt fueled fiscal spend. In fact, we want fiscal spending to fall because we’re collectively borrowing from our future to spur current demand. Even though the debt will never be repaid or defaulted upon (too painful), it will have to be inflated away, and inflation can come too quickly as our supply chains are recovering at a slower pace. So governments have started their own “tapering,” reducing the doses of nitro as we resuscitate the economy.
Enter the waning fiscal impulse above. Fiscal spending will begin to trend lower as we navigate the latter half of 2021 and into 2022. As governments’ dial-back, and as consumers spend down their pent-up savings, the fiscal impulse wears off.
Still, looking only at the left side of the chart would be incomplete. Oil investors need to keep in mind the right side as well, which is the bigger picture. The right side shows global GDP growth, and although it’s slowing, it’s still positive despite fiscal impulse turning negative. It is still growing, and for oil investors that’s what ultimately matters because this is how oil works in the real world . . .
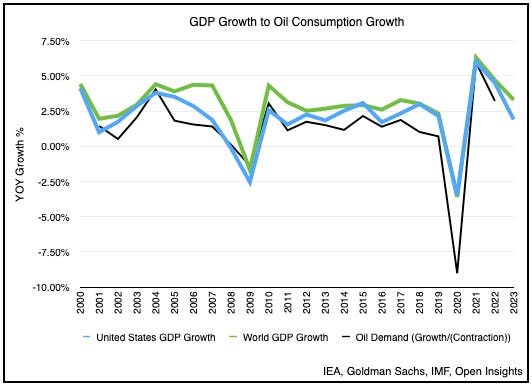
Oil consumption follows GDP growth, and if global GDP grows, so will oil demand. Goldman Sachs projects global GDP to grow 6.3% in 2021. 2022 and 2023? 4.7% and 3.3%, respectively, which would follow the ~3% global growth rate we notched pre-COVID.
If the roughly 2/3rds translation of oil demand growth to GDP growth continues, then similarly, oil demand should grow 3% and 2% in 2022 and 2023, respectively. This means 3M bpd of demand increase in 2022 and another 2M bpd of demand increase the following year. So is fiscal impulse falling? Yes. Impulse is falling globally as we recover here, but it has to otherwise the threat of overheating the economy increases. Nevertheless, declining fiscal impulse shouldn’t translate to a fall in the consumption of petroleum products. We’re still growing our economy, and in turn our appetite for fossil fuels. So take a breath and let’s not be too impulsive about fading fiscal impulse.
Musing on Student Loans
One other thing we we’re pondering this week was the income redistribution that’s slowly occurring, but not attracting huge headlines. It’s this . . .
Now there’s no doubt in our minds that this needed to occur as the 320K borrowers above have disabilities (total or permanent). Frankly, what’s the societal benefit of garnishing someone’s wages when they’re already totally or permanently disabled? $5.8B . . . well forgiven. This cancellation, however, follows the earlier decision by the Department of Education to provide loan relief for 18,000 borrowers who attended a private institution called ITT Technical Insittue, which turned out to be fraudulent.
As noted in the title, the “ITT” forgiveness was $0.5B.
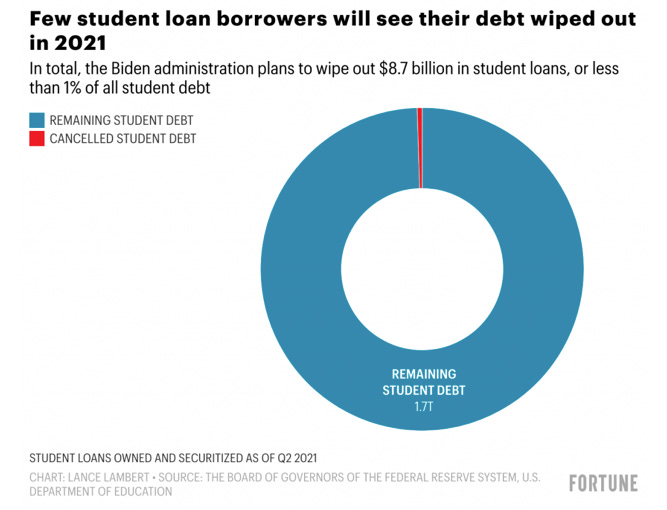
So far, the Biden Administration has cancelled nearly $8.7B of student loans, which is a small drop in the ocean that’re student loans.
What’s interesting here isn’t the amount that’s been forgiven. It’s the steady pace of forgiveness, and the potential size that could be forgiven. Let’s explain.
The Pool of Borrowers
~43M Americans, or basically 20% of all adults in the US, owe collectively $1.73T of student loans, or $37,000 per borrower. Only half of these recipients are financially independent, which means the other half are straddling their caregivers with consequences of that debt.
Student loans are our second largest block of debt, only after mortgage debt and it exceeds auto loans. It represents ~10% of our overall personal debt in the US.
3.3M (15% of student borrowers under 40 years old) are behind on their student loan payments. 338K (17% of student borrowers under 25 years old) are behind on their student loan payments. Black college students are the most likely to use federal loans (with ~50% borrowing). Almost 1/3 of these students who actually graduate, default on their loans in the first 12 years of repayment. White/caucasian borrowers owe 54% of the national student loan debt balance.
The student loan experience has undoubtedly been problematic for many, and the debt has arguably saddled an entirely new generation. Here’s a few issues:
So why do we raise this issue? Because despite the Biden Administration’s targeted loan forgiveness, the flow of forgiveness has been steady. What’s noteworthy isn’t the size, but the fact that it’s happening. We think more could come because of two key figures . . . $3.5T and 92%.
$3.5T Human Infrastructure Bill
The $3.5T figure relates to the Democrats $3.5T “human” infrastructure bill, which is moving through Congress in parallel with the $1T bipartisan “physical” infrastructure bill. We believe the larger infrastructure bill represents an attempt by Democrats to address one of the core issues of student loans, slowing their growth. Private, for profit colleges, have saddled minority groups with a disproportionate amount of student loan debt. The ease of lending and low accountability meant many students graduated with few job prospects and low wages. Often times, the students could have enrolled in a much cheaper community college and then transferred to a four year institution to earn a more marketable degree. Yet, the private colleges (in the pursuit of profit) specifically targeted the underserved communities, communities of color, and select minority groups. This in part explains why the $3.5T human infrastructure bill would make community colleges tuition free for two years, which would broaden access to students and likely reduce the amount of debt borrowed going forward.
The other key figure in all of this? 92%.
If the bill helps to tackle the rate of change, what about the ills of the past? 92% of the the $1.73T in student loans are held by the federal government. President Biden has thus far only pursued targeted student loan forgiveness because he lacks the legal authority for wider forgiveness without Congressional approval. The targeting, however, could prime the pump for a broader program among the electorate.
Congress is currently split on the issue because on one hand forgiving student loan debt does make sense given its drag on GDP, but on the other, the price tag, the regressive nature of loan forgiveness (it disproportionately benefits those with higher incomes), and the moral hazard of widespread loan forgiveness are strong obstacles to overcome, obstacles not just between Democrats and Republicans, but also between progressive and moderate Democrats. It’s the reason why loan forgiveness was left out of the proposed $3.5T human infrastructure bill. Still, that’s not to say it won’t come around again. Student loans are held by Americans that cut across a broad swath of demographic groups, and forgiveness (at least for those in need) poll exceedingly well (66% of Americans favor it). Try getting 2/3rds of Americans to agree on anything.
Even a partial forgiveness of $10,000, a figure bandied about in Congress, would be equivalent to $400B, or a third larger than the $300B budgeted when the government handed out $1,200 stimulus checks in the CARES Act. This is a wealth transfer issue, but one that’s really popular, so watch this space closely. If handing out checks isn’t as popular anymore, then perhaps forgiving debt would become much more palatable. It could be the next stimulus, albeit a stealthier one.


