What's the Point? Oil on Canvas.
January 7, 2022
It’s a blank slate. That’s what we’re staring at as we start the new year on our computer screen. It’s a blinking cursor amidst a sea of white, or a winking polar bear in a snowstorm. Time to fill the pages with some colorful insights, give some “road ahead” for 2022, and maybe lay out some forecasts because after all what’s a new year without some new predictions.
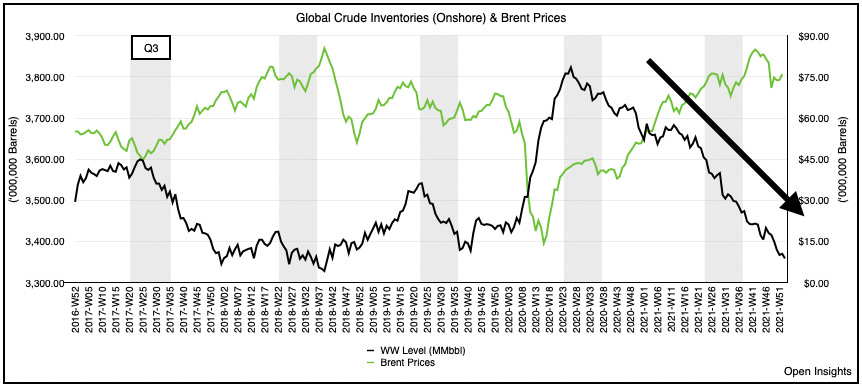
Nah. What’s the point really? Has anything really changed between December 31st and January 1st, except maybe our little planet just did a single pirouette? Sure maybe we dropped another glistening ball in New York’s Time Square, but does it matter? We don’t think so because our investing themes are the same and everything continues as is. For us, our energy thesis crosses into the new year. Update the global inventory charts and you can see why. In 2021, we globally drew 1.9M barrels per day of petroleum stocks.
The chart above is courtesy of Morgan Stanley. Just take a look at that 2021 line. There’s almost no variation to the pace. It was a trickle, every . . . single . . . day. Take a deeper dive and we can see that almost half of those draws were of crude.
Crude itself drew by ~1M bpd and nearly at the same steady pace. We can plainly see why though. Even with oil averaging over $67 WTI / $70 Brent for the entire year, producers have only slowly come back.
US rig counts are still lower by ~30% from January 2020 levels and non-US rig counts by ~20%. Zoom in further on non-US rig counts and we see that while rig counts everywhere else besides OPEC+ has almost recovered, OPEC+ itself hasn’t, which means they’re either slow playing the recovery (likely) and/or unable to add rigs because of field issues (also likely) as some producers struggle to increase production.
Whether it was Delta during the summer or Omicron in the past four weeks impacting demand, it hasn’t mattered much. The market was chronically undersupplied in 2021, and despite flipping the calendar to the new year, it continues to be so.
Nevertheless, we should have a bit of a reprieve in Q1/Q2 as global demand typically falls by ~1-1.5M bpd, so there’s a seasonal component that we’ll be dealing with shortly. As OPEC+ continues to add supplies to the market, the question becomes whether recovering oil demand can absorb the extra supplies (and whether seasonal weakness will lead to inventory builds). Net/net, we’re anticipating a fairly flat H1 for inventories. This’ll be eye opening because inventories should build during this time so they can draw later during the higher demand seasons. If inventories are flat, we could be in for a repeat of H1 2018, which means oil prices really begin to climb in the middle of the year as the market figures out . . . it’s going to get tighter. Moreover, by then OPEC+ spare capacity will also be much clearer, and we’ll know if the Emperor really has any clothes on. We’ll elaborate on both topics a bit more shortly (we’re scheduled to send out our Q4 letter in a few weeks), for now just know. Inventories? Yeah they’re still falling.
Other Thoughts
Other things we’ve been pondering during our little holiday break was past recessions and various indicators. Yeah amidst the parties and the presents, our mind wandered to economic indicators . . . there’s probably a couch and a doctor somewhere for that.
If you’ve read our articles, you know that we try to link monetary/fiscal policy with business dynamics to understand the “big picture” and how it impacts specific industries. Our thesis today is relatively straightforward. Interest rates cover investors for two things. Risk of loss and inflation. If inflation continues to push upwards, interest rates must rise. Whether the market forces the issue and/or the Fed (flipping from quantitative easing to quantitative tightening and raising interest rates (both to tame rising inflation)), the impacts are the same. Interest rates will rise. In turn, interest rates are gravity, and the higher it goes, the higher the likelihood asset prices will fall, especially the high growth/high-tech assets that were all the rage in 2021. Fashion is as fickle, as is the market, and lately as interest rates have risen, tech stocks have fallen.
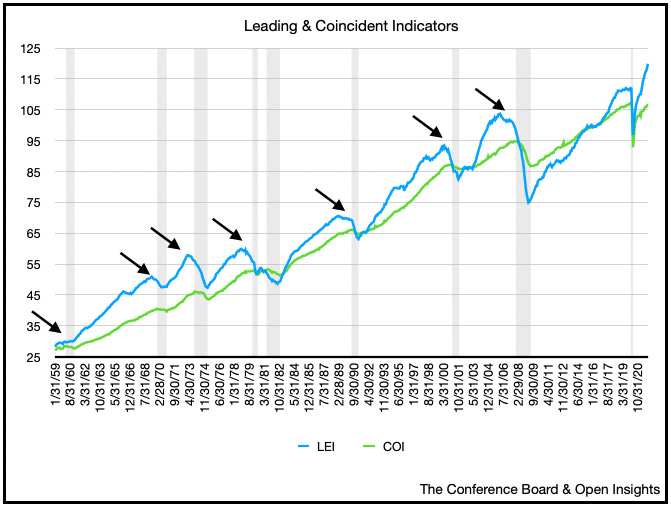
That’s the market though, it rebalances itself as the conditions change. Whether it will fall over the edge, however, and whether the economy will slow to a recession is something different. As we look at the economy, we’re paying attention to a few things. Labor, housing, interest rates, and energy. Heck we’ll even throw in leading indicators. Market participants have typically used them as a dashboard to indicate the likelihood of a recession, and while we look at them, we’re not entirely sure we give as much credence because placing arrows next to recessionary point exposes our brains to quite a bit of hindsight bias. Nonetheless, we track them because market participants do too, and we present them here. Grey lines are past “recessions” as determined by the National Bureau of Economic Research.
Here’s labor, specifically weekly unemployment claims.
Here’s housing, something that drives the economy as we build it, sell it, and then furnish it. Decline in sales could indicate a slowing of the economy.
Here’s interest rates. The flatter the yield curve, the more it portends a slowing economy and a “risk off” mindset.
Here’s energy. Higher the prices, the bigger the drag on the global economy.
Lastly, here’s leading economic indicators (i.e., a conglomeration of yield curve, durable goods orders, the stock market, manufacturing orders and building permits).
So have we tipped over? We don’t think so as we’re globally still recovering. As Omicron fades and as we begin to push higher, we think China will take the lead. China’s recovery will accelerate as they reopen, but it won’t be without starts and stops given their lack of immunity from the zero COVID tolerance policies (yes we know of their vaccines), which means China’s monetary/fiscal stimulus may increase. So while the West slows its monetary and fiscal largesse, China will likely take the baton after two years of sheltering in place and one year of regulatory crackdowns. As they reemerge less indebted, less bubbly, more nationalistic, politically stable and aggressive about taking a global leadership role, we think it could take the global economy in a different direction. Nonetheless, we track the indicators because they do provide a clue as to where we are and where we’ve been, especially in the US. Just be careful with them because in hindsight, everything is always obvious, but it’s just another few dots in our global Seurat painting. Wait . . . is that a cliff?!
We hope you had a wonderful and safe holiday season. Looking forward to a joyful and prosperous 2022. Happy New Year.
Please hit the “like” button below if you enjoyed reading the article, thank you.


