When Margot Robbie Explains Refinery Margins, Ya Best Pay Attention
June 1, 2024
You work in the money management industry long enough and you eventually learn that things aren’t what they are. People who appear knowledgeable aren’t, and those who are confident can’t or don’t deliver. In reality, it’s no different in other industries, but the veneer of “fake-it-til-you-make-it” is stronger in this one.
In time though, you eventually learn what matters. People that matter, things that matter, ideas that matter, and indicators that matter. Fail to discern those things though, and it’ll cost you. Capital, opportunities, insights, and most importantly time.
I’m pondering these things today because of a chart I recently pulled. A decent little one that helps cut through the foggy haze of uncertainty.
This chart.
This my friends is the 3-2-1 crack spread, a quick rule of thumb for refinery margins. Like in the movie The Big Short . . . let’s have Margot Robbie explain what the 3-2-1 spread is (using the EIA’s definition of course) . . .
“A crack spread measures the difference between the purchase price of crude oil and the selling price of finished products, such as gasoline and distillate fuel, that a refinery produces from the crude oil. Crack spreads are an indicator of the short-term profit margin of oil refineries because they compare the cost of the crude oil inputs to the wholesale, or spot, prices of the outputs (although they do not include other variable costs or any fixed costs). The 3:2:1 crack spread approximates the product yield at a typical U.S. refinery: for every three barrels of crude oil the refinery processes, it makes two barrels of gasoline and one barrel of distillate fuel.”
Got that?
Hello?
Ahem . . . eyes back here.
Refineries mind you are those giant industrial plants that refine crude oil into higher grades of combustible transportation fuels like gasoline, diesel and jet fuel.
They also produces other oils used in heating, plastics manufacturing, and industrial applications (like creating solvents/lubricants, etc.). The real money though is in the former applications, stuff that makes stuff go zooooom.
Why do we bring this up? Because these margins of late . . . they look sickly. Take a look again . . .
Sickly isn’t good because what’s the implications of the economy if gasoline, diesel, and jet fuel are weak? Global spreads look no better, and they’re equally as lethargic. If pricing is telling you that refineries may not be able to make as much, or turn a profit, then we’re likely talking run cuts, and in turn, falling crude demand.
Bad for energy prices, and bad for energy stocks.
More broadly, there’s implications for the broader economy. Refinery margins are a read through for the economy since fossil fuels, more or less, are ubiquitous and interchangeable, falling demand for transportation fuel equates to less people traveling (via cars and jets), and less “stuff” being moved (via trucks). So does it portend to a softening of the economy?
Perhaps, but it’s not entirely clear.
It’s tough to square because we’re seeing passengers board planes,
. . . and stuff board trains.
Yet, again . . . refinery cracks.
Usually too, falling oil prices (which has been occurring for the past month as the geopolitical premium faded) should lift refinery margins (i.e., they buy cheaper crude and make a larger profit on the transportation fuels). Still that hasn’t been the case as the spread continues to fall.
As for crude oil prices? No need to get fancy, just overlay oil prices to that chart, and you can see, refinery margins lead crude prices (blue line). It’s ugly, but it’s quick.
Makes sense because refinery demand for crude drives . . . demand for crude. Now here’s the kicker. The above could simply be the paper market swinging the physical market. Below are the managed money positions for gasoline and diesel, and you can see they’re near all-time lows.
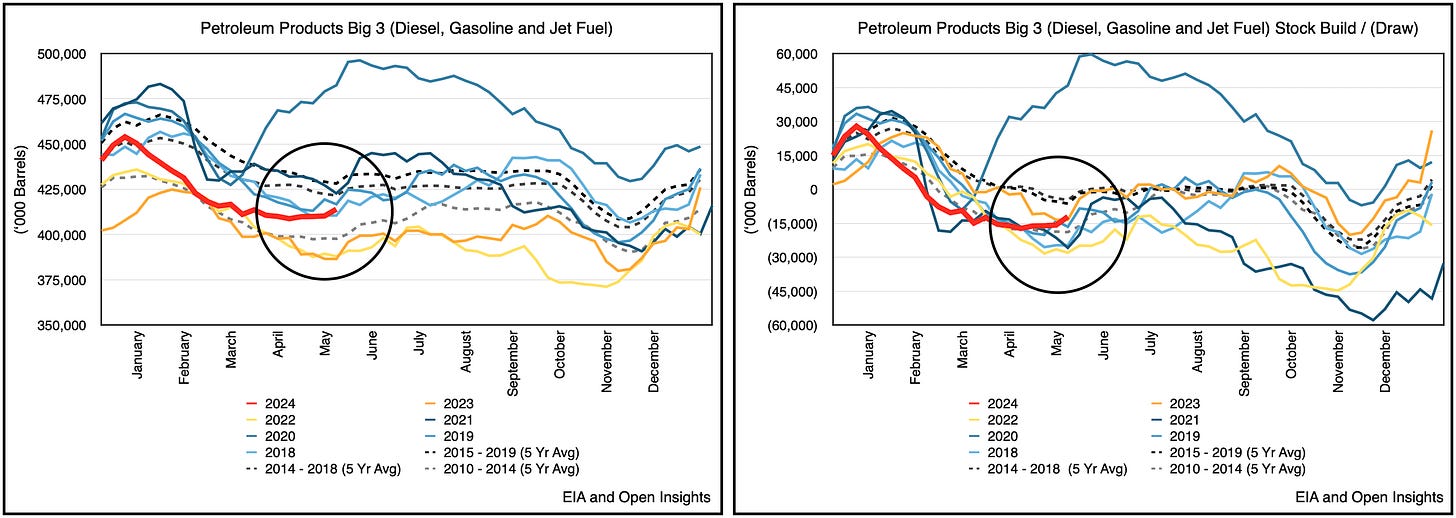
That’s quite bearish for arguably “meh” (and not horrific inventory levels) in the US.
If we zoom out a bit, we can see OECD inventories have built more than average quarter-to-date, but a swing of one or two reports could get us back to trend for the quarter.
Said another way, it’s been a bearish Q2, but not egregiously so.
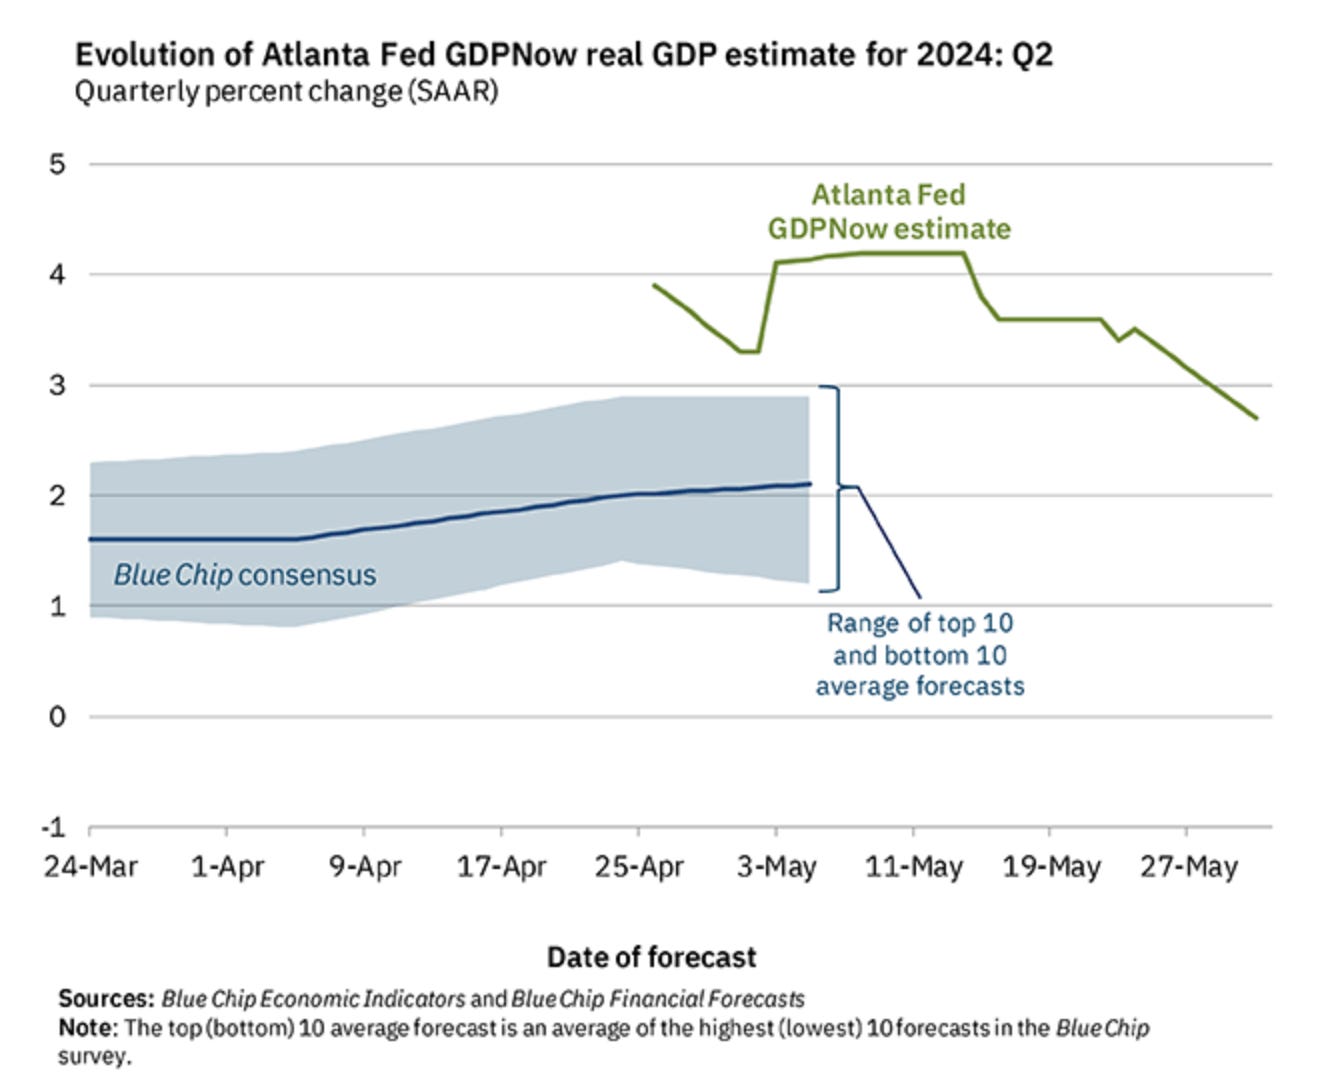
To be fair though, we’ll know soon enough. Could GDP be weakening? Could the economy be “malaising?” Possibly . . .
So pay attention. As we’ve crossed into June, and the heavy travel demand season of June - August, now’s the time to start moving and for refinery margins to increase. If refinery margins don’t in the coming weeks, that’s telling you something. In real-time, gasoline, diesel and jet fuel demand is way off, and if it’s off, you can draw the implications of what happens to crude oil prices and more broadly how and what the consumers are doing.
For us, it’s all connected. One relates to another, but don’t worry this weekend. You have this weekend to relax and ponder the above as you sip some more champagne with Ms. Robbie.
Thanks Margot. Can we call you Margot?
Great movie.
Please hit the “like” button above if you enjoyed reading the article, thank you.


The amount of refining capacity brought online global the last 18 months is another variable to consider. Refining margins normalizing to pre Covid levels as we conclude a heavy H1 maintenance period may be where we are headed with +3.5-4Mbpd of throughput coming online from end of April to August according to GS.
I’m thinking this has had an impact on cracks 🤷♂️ I would guess they are not exactly pushing prices higher dumping a millions barrels into the market.
WASHINGTON, May 21 (Reuters) - President Joe Biden's administration will sell nearly 1 million barrels of gasoline in the U.S.-managed stockpile in northeastern states as required by law, the Department of Energy said on Tuesday, effectively closing the reserve.